|
2100
|
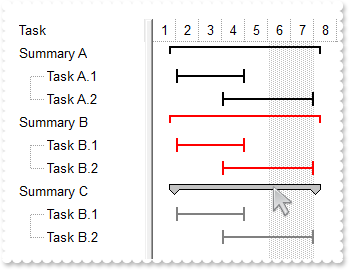
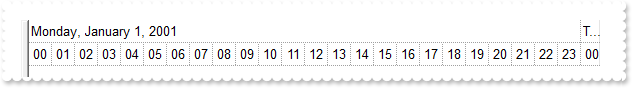
Can bars have a grey backcolor and black border color for a summary-bar (EBN)
local hSummaryJ,hSummaryK,hSummaryN,hTaskJ,hTaskK,oG2antt,var_Appearance,var_Bar,var_Bar1,var_Bar2,var_Chart,var_Items

oG2antt = form.EXG2ANTTCHARTACTIVEXCONTROL1.nativeObject
oG2antt.BeginUpdate()
var_Appearance = oG2antt.VisualAppearance
	var_Appearance.RenderType = -2
	var_Appearance.Add(1,"gBFLBCJwBAEHhEJAAEhABN0GACAADACAxRDAMgBQKAAzQFAYahuGSGAAGMYxQgmFgAQhFcZQSKUOQTDKMIziYBYJhEMQyDAAUIjOKsIhkGYcZAGQBJCjWGodQLOEgwHIERQjEyUJAGGQIHhyPYbUbGUpQHKkeRtGqgBgoKhKEouNYgAbGYIwTRsdyfDSXBpEWwbDgkNQwWTDNoRDIUQStCysaYjOpnfrUAJ1P7FdQ1NJkXRhGSSK7maapaiCSZ6STCMj1FhVKSNJ7DQKhGpgKh/ApgYpQOK4fLNXyRBK4QAyKA6bgPFZOZbFViaXY1V5bNKrcjhHQwAyHJ4XXRdV4YRAkUT4GqiJKGSYcQhuXZWbRqO6ABhef6DRThc6jKpFHIE4llEcojHqSZNgoIxnlgd5thsLREleL43gsYZ9BkaAYkMAgAm+CxGDWWAtiKCRfjcdRgHoHYnicUwgAIEIREAaQYkcQZUHIGRUDQJBOEYRAhDYCxGgMZAkCgdYQhaXQIAYERwQuahXggdgeG6VZ4H4IhdiIGIOB8YIiGiHZZgqYpGF4KYHiKCI+CAU5jCiTQ2g0YhEFyax4gABAEIC")
	var_Appearance.Add(2,"gBFLBCJwBAEHhEJAAEhABU0IQAAYAQGKQYhiAKBQAGaAoDDcMA4QwAAyjAKMEwsACEIrjKCRShyCYZRhGcTAJBMIhiGQYAChEZxVhEMgzDjIAxSJAcQRFESaAABGCQGh+N4/S4NIi0CIsZQjCaiZ7pKA5bgMCo+UrNMixZQVCSOGChYRpCaZWpGGodQRUFbVHAlKypJKCKrEWSrDhuYAAW7XM7yBS1TzVNSuLZtaLqSroAJ1WTWMB0Ra8NzZEKfaZACj4arKejrRDCMAggI=")
	var_Appearance.Add(3,"gBFLBCJwBAEHhEJAAEhABN8GACAADACAxRDgMQBQKAAzQFAcDBvBgABiHEZoJhUAIIRZGMIjFDcEwxDSMY7jcYAFgkNQwCUtcBIJDEMIoAJLIwyBKkNQ5AabYrmWJpMgOEAyDSJM70DCEThLD4aZJnOa5ZjmH5LRBQdBRXQMYwIGCiZQpeKqbgMBoJApCIJxdBNLAAf60LLtGJaSpKZouViJNjSBD4HQTL6BQwsKxIDqaaD/WpgFuLTjiRImShcMQXJYFbwTOyBbDjG7rJr+FptYRbdYYRQ8dy7Cywa6pOa8YwacotZrAdDXHTmHw1PTRNDmTRYRwfKqJZxieqwHoMLYgAC8Ni3OaoDAiCRQGiYZyHKaRSwPBInIYIIjeRgzBSAYKCEOySEodZbjybo0HefwfhMLQDnKeg9D6LwsCeV5unYQJYH8Lxvj+a5jgSfIYH8T43hOcZ5H+X4nh2fB6F+aABnOAIfFgFgGgGH43nICoCl+eA1n0fBhAgVZ5gSHoID4FoDCCCBqBuBYUjgfgigGURYg4JoJmKCBFBaChikiNgVEYYpokYMoMCMKJWCkcIjgiZg6E0Do3gUASAg=")
oG2antt.Columns.Add("Task")
var_Chart = oG2antt.Chart
	// var_Chart.PaneWidth(false) = 128
	with (oG2antt)
		TemplateDef = [dim var_Chart]
		TemplateDef = var_Chart
		Template = [var_Chart.PaneWidth(False) = 128]
	endwith
	var_Chart.FirstVisibleDate = "01/01/2001"
	var_Bar = var_Chart.Bars.Item("Task")
		// var_Bar.Def(4) = 18
		with (oG2antt)
			TemplateDef = [dim var_Bar]
			TemplateDef = var_Bar
			Template = [var_Bar.Def(4) = 18]
		endwith
		var_Bar.Color = 0x1000000
	var_Bar1 = var_Chart.Bars.Item("Summary")
		// var_Bar1.Def(4) = 18
		with (oG2antt)
			TemplateDef = [dim var_Bar1]
			TemplateDef = var_Bar1
			Template = [var_Bar1.Def(4) = 18]
		endwith
		var_Bar1.Color = 0x2000000
	var_Bar2 = var_Chart.Bars.Copy("Summary","SummaryN")
		// var_Bar2.Def(4) = 18
		with (oG2antt)
			TemplateDef = [dim var_Bar2]
			TemplateDef = var_Bar2
			Template = [var_Bar2.Def(4) = 18]
		endwith
		var_Bar2.Color = 0x3000000
var_Items = oG2antt.Items
	hSummaryJ = var_Items.AddItem("Summary A")
	var_Items.AddBar(hSummaryJ,"Summary","01/02/2001","01/02/2001","J")
	hTaskJ = var_Items.InsertItem(hSummaryJ,null,"Task A.1")
	var_Items.AddBar(hTaskJ,"Task","01/02/2001","01/05/2001","J1")
	hTaskJ = var_Items.InsertItem(hSummaryJ,null,"Task A.2")
	var_Items.AddBar(hTaskJ,"Task","01/04/2001","01/08/2001","J2")
	var_Items.DefineSummaryBars(hSummaryJ,"J",-1,"<*>")
	hSummaryK = var_Items.AddItem("Summary B")
	var_Items.AddBar(hSummaryK,"Summary","01/02/2001","01/02/2001","K")
	hTaskK = var_Items.InsertItem(hSummaryK,null,"Task B.1")
	var_Items.AddBar(hTaskK,"Task","01/02/2001","01/05/2001","K1")
	hTaskK = var_Items.InsertItem(hSummaryK,null,"Task B.2")
	var_Items.AddBar(hTaskK,"Task","01/04/2001","01/08/2001","K2")
	var_Items.DefineSummaryBars(hSummaryK,"K",-1,"<*>")
	hSummaryN = var_Items.AddItem("Summary C")
	var_Items.AddBar(hSummaryN,"SummaryN","01/02/2001","01/02/2001","SN")
	hTaskK = var_Items.InsertItem(hSummaryN,null,"Task B.1")
	var_Items.AddBar(hTaskK,"Task","01/02/2001","01/05/2001","N1")
	hTaskK = var_Items.InsertItem(hSummaryN,null,"Task B.2")
	var_Items.AddBar(hTaskK,"Task","01/04/2001","01/08/2001","N2")
	var_Items.DefineSummaryBars(hSummaryN,"SN",-1,"<*>")
	// var_Items.ItemBar(0,"<K*>",33) = 255
	with (oG2antt)
		TemplateDef = [dim var_Items]
		TemplateDef = var_Items
		Template = [var_Items.ItemBar(0,"<K*>",33) = 255]
	endwith
	// var_Items.ItemBar(0,"<N*>",33) = 8421504
	with (oG2antt)
		TemplateDef = [dim var_Items]
		TemplateDef = var_Items
		Template = [var_Items.ItemBar(0,"<N*>",33) = 8421504]
	endwith
	// var_Items.ExpandItem(0) = true
	with (oG2antt)
		TemplateDef = [dim var_Items]
		TemplateDef = var_Items
		Template = [var_Items.ExpandItem(0) = True]
	endwith
oG2antt.EndUpdate()
|
|
2099
|
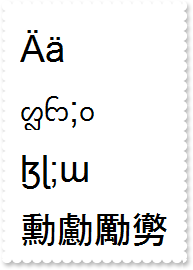
How can I display UNICODE characters
local oG2antt,var_Chart,var_Column,var_Items,var_StdFont

oG2antt = form.EXG2ANTTCHARTACTIVEXCONTROL1.nativeObject
oG2antt.BeginUpdate()
// oG2antt.Chart.PaneWidth(true) = 0
var_Chart = oG2antt.Chart
with (oG2antt)
	TemplateDef = [dim var_Chart]
	TemplateDef = var_Chart
	Template = [var_Chart.PaneWidth(True) = 0]
endwith
var_StdFont = oG2antt.Font
	var_StdFont.Name = "Arial Unicode"
	var_StdFont.Size = 22
oG2antt.HeaderVisible = false
oG2antt.DefaultItemHeight = 48
// oG2antt.Columns.Add("").Def(17) = 1
var_Column = oG2antt.Columns.Add("")
with (oG2antt)
	TemplateDef = [dim var_Column]
	TemplateDef = var_Column
	Template = [var_Column.Def(17) = 1]
endwith
var_Items = oG2antt.Items
	var_Items.AddItem("Ӓӓ")
	var_Items.AddItem("ᦜᦝ;ᦞ")
	var_Items.AddItem("ɮɭ;ɯ")
	var_Items.AddItem("勳勴勵勶")
	// var_Items.FormatCell(var_Items.AddItem(oG2antt.Version),0) = "(value lfind `UNICODE`) < 0 ? `<fgcolor=FF0000><b>!UNICODE!</b> version</fgcolor> required: ` + value : `` "
	with (oG2antt)
		TemplateDef = [dim var_Items]
		TemplateDef = var_Items
		Template = [var_Items.FormatCell(AddItem(Me.Version),0) = "(value lfind `UNICODE`) < 0 ? `<fgcolor=FF0000><b>!UNICODE!</b> version</fgcolor> required: ` + value : `` "]
	endwith
oG2antt.EndUpdate()
|
|
2098
|
How can I display 12-hour time (method 2)
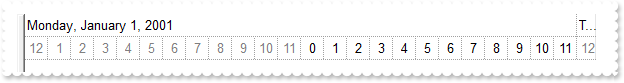
local oG2antt,var_Chart,var_Level,var_Level1

oG2antt = form.EXG2ANTTCHARTACTIVEXCONTROL1.nativeObject
oG2antt.BeginUpdate()
var_Chart = oG2antt.Chart
	var_Chart.FirstVisibleDate = "01/01/2001"
	// var_Chart.PaneWidth(false) = 0
	with (oG2antt)
		TemplateDef = [dim var_Chart]
		TemplateDef = var_Chart
		Template = [var_Chart.PaneWidth(False) = 0]
	endwith
	var_Chart.LevelCount = 2
	// var_Chart.Level(0).Label = 4096
	var_Level = var_Chart.Level(0)
	with (oG2antt)
		TemplateDef = [dim var_Level]
		TemplateDef = var_Level
		Template = [var_Level.Label = 4096]
	endwith
	var_Level1 = var_Chart.Level(1)
		var_Level1.Unit = 65536
		var_Level1.FormatLabel = "(0 := hour(dvalue)) < 12 ? ( `<fgcolor=808080>` + ( =:0 = 0 ? 12 : =:0 ) + `</fgcolor>` ) : (=:0 - 12)"
oG2antt.EndUpdate()
|
|
2097
|
How can I display 12-hour time (method 1)
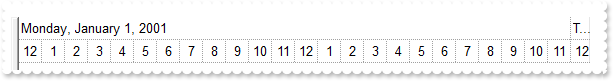
local oG2antt,var_Chart,var_Level,var_Level1

oG2antt = form.EXG2ANTTCHARTACTIVEXCONTROL1.nativeObject
oG2antt.BeginUpdate()
var_Chart = oG2antt.Chart
	var_Chart.FirstVisibleDate = "01/01/2001"
	// var_Chart.PaneWidth(false) = 0
	with (oG2antt)
		TemplateDef = [dim var_Chart]
		TemplateDef = var_Chart
		Template = [var_Chart.PaneWidth(False) = 0]
	endwith
	var_Chart.LevelCount = 2
	// var_Chart.Level(0).Label = 4096
	var_Level = var_Chart.Level(0)
	with (oG2antt)
		TemplateDef = [dim var_Level]
		TemplateDef = var_Level
		Template = [var_Level.Label = 4096]
	endwith
	// var_Chart.Level(1).Label = "<%h12%>"
	var_Level1 = var_Chart.Level(1)
	with (oG2antt)
		TemplateDef = [dim var_Level1]
		TemplateDef = var_Level1
		Template = [var_Level1.Label = "<%h12%>"]
	endwith
oG2antt.EndUpdate()
|
|
2096
|
How do I scale to hours
local oG2antt,var_Chart,var_Level,var_Level1

oG2antt = form.EXG2ANTTCHARTACTIVEXCONTROL1.nativeObject
oG2antt.BeginUpdate()
var_Chart = oG2antt.Chart
	var_Chart.FirstVisibleDate = "01/01/2001"
	// var_Chart.PaneWidth(false) = 0
	with (oG2antt)
		TemplateDef = [dim var_Chart]
		TemplateDef = var_Chart
		Template = [var_Chart.PaneWidth(False) = 0]
	endwith
	var_Chart.LevelCount = 2
	// var_Chart.Level(0).Label = 4096
	var_Level = var_Chart.Level(0)
	with (oG2antt)
		TemplateDef = [dim var_Level]
		TemplateDef = var_Level
		Template = [var_Level.Label = 4096]
	endwith
	// var_Chart.Level(1).Label = 65536
	var_Level1 = var_Chart.Level(1)
	with (oG2antt)
		TemplateDef = [dim var_Level1]
		TemplateDef = var_Level1
		Template = [var_Level1.Label = 65536]
	endwith
oG2antt.EndUpdate()
|
|
2095
|
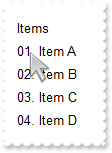
How do I display the position of the item with 0-padding
local oG2antt,var_Column,var_Items

oG2antt = form.EXG2ANTTCHARTACTIVEXCONTROL1.nativeObject
oG2antt.BeginUpdate()
// oG2antt.Columns.Add("Items").FormatColumn = "((1 apos ``) lpad `00`) + `. `  + value"
var_Column = oG2antt.Columns.Add("Items")
with (oG2antt)
	TemplateDef = [dim var_Column]
	TemplateDef = var_Column
	Template = [var_Column.FormatColumn = "((1 apos ``) lpad `00`) + `. `  + value"]
endwith
var_Items = oG2antt.Items
	var_Items.AddItem("Item A")
	var_Items.AddItem("Item B")
	var_Items.AddItem("Item C")
	var_Items.AddItem("Item D")
oG2antt.EndUpdate()
|
|
2094
|
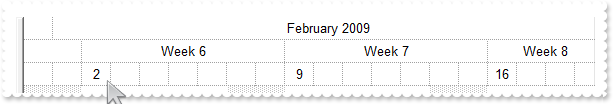
Can I format the label in row 3 below to show day numbers, only for Mondays each week (sample 2)

local oG2antt,var_Chart,var_Level,var_Level1,var_Level2

oG2antt = form.EXG2ANTTCHARTACTIVEXCONTROL1.nativeObject
var_Chart = oG2antt.Chart
	// var_Chart.PaneWidth(false) = 0
	with (oG2antt)
		TemplateDef = [dim var_Chart]
		TemplateDef = var_Chart
		Template = [var_Chart.PaneWidth(0) = 0]
	endwith
	var_Chart.FirstVisibleDate = "01/31/2009"
	var_Chart.LevelCount = 3
	var_Chart.FirstWeekDay = 1
	var_Level = var_Chart.Level(0)
		var_Level.Label = "<%mmmm%> <%yyyy%>"
		var_Level.Alignment = 1
		var_Level.Unit = 16
	var_Level1 = var_Chart.Level(1)
		var_Level1.Unit = 256
		var_Level1.Label = "Week <%ww%>"
		var_Level1.Alignment = 1
	var_Level2 = var_Chart.Level(2)
		var_Level2.Unit = 4096
		var_Level2.FormatLabel = "weekday(dvalue) = 1 ? day(dvalue): ''"
	var_Chart.UnitWidth = 23
|
|
2093
|
Can I format the label in row 3 below to show day numbers, only for Mondays each week (sample 1)
local oG2antt,var_Chart,var_Level,var_Level1,var_Level2

oG2antt = form.EXG2ANTTCHARTACTIVEXCONTROL1.nativeObject
var_Chart = oG2antt.Chart
	// var_Chart.PaneWidth(false) = 0
	with (oG2antt)
		TemplateDef = [dim var_Chart]
		TemplateDef = var_Chart
		Template = [var_Chart.PaneWidth(0) = 0]
	endwith
	var_Chart.FirstVisibleDate = "01/31/2009"
	var_Chart.LevelCount = 3
	var_Chart.FirstWeekDay = 1
	var_Level = var_Chart.Level(0)
		var_Level.Label = "<%mmmm%> <%yyyy%>"
		var_Level.Alignment = 1
		var_Level.Unit = 16
	var_Level1 = var_Chart.Level(1)
		var_Level1.Unit = 256
		var_Level1.Label = "Week <%ww%>"
		var_Level1.Alignment = 1
	var_Level2 = var_Chart.Level(2)
		var_Level2.Unit = 4096
		var_Level2.FormatLabel = "weekday(dvalue) = 1 ? value : ''"
	var_Chart.UnitWidth = 23
|
|
2092
|
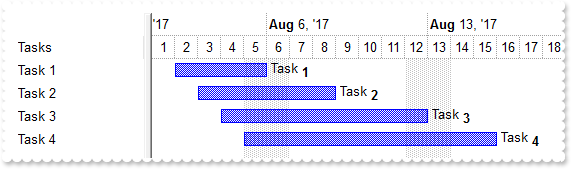
How can I change the caption for all bars
local oG2antt,var_Bar,var_Chart,var_Items

oG2antt = form.EXG2ANTTCHARTACTIVEXCONTROL1.nativeObject
oG2antt.BeginUpdate()
oG2antt.Columns.Add("Tasks")
var_Chart = oG2antt.Chart
	var_Chart.FirstVisibleDate = "08/01/2017"
	var_Chart.LevelCount = 2
	// var_Chart.PaneWidth(false) = 128
	with (oG2antt)
		TemplateDef = [dim var_Chart]
		TemplateDef = var_Chart
		Template = [var_Chart.PaneWidth(False) = 128]
	endwith
	var_Bar = var_Chart.Bars.Add("Task%Progress")
		var_Bar.Shortcut = "Task"
		// var_Bar.Def(14) = true
		with (oG2antt)
			TemplateDef = [dim var_Bar]
			TemplateDef = var_Bar
			Template = [var_Bar.Def(14) = True]
		endwith
var_Items = oG2antt.Items
	var_Items.AddBar(var_Items.AddItem("Task 1"),"Task","08/02/2017","08/06/2017")
	var_Items.AddBar(var_Items.AddItem("Task 2"),"Task","08/03/2017","08/09/2017")
	var_Items.AddBar(var_Items.AddItem("Task 3"),"Task","08/04/2017","08/13/2017")
	var_Items.AddBar(var_Items.AddItem("Task 4"),"Task","08/05/2017","08/16/2017")
	// var_Items.ItemBar(0,"<*>",14) = false
	with (oG2antt)
		TemplateDef = [dim var_Items]
		TemplateDef = var_Items
		Template = [var_Items.ItemBar(0,"<*>",14) = False]
	endwith
	// var_Items.ItemBar(0,"<*>",3) = "<%= %C0 replace `Task` with `Task<off 4><b>` %>"
	with (oG2antt)
		TemplateDef = [dim var_Items]
		TemplateDef = var_Items
		Template = [var_Items.ItemBar(0,"<*>",3) = "<%= %C0 replace `Task` with `Task<off 4><b>` %>"]
	endwith
	// var_Items.ItemBar(0,"<*>",4) = 18
	with (oG2antt)
		TemplateDef = [dim var_Items]
		TemplateDef = var_Items
		Template = [var_Items.ItemBar(0,"<*>",4) = 18]
	endwith
oG2antt.EndUpdate()
|
|
2091
|
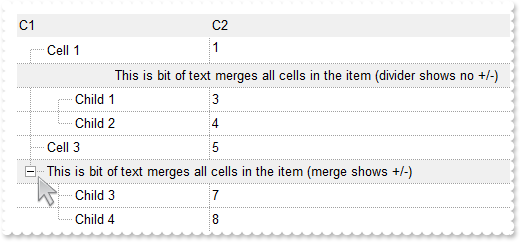
Can't get the +/- to be displayed on a divider item. What else can I do
local h,oG2antt,var_Chart,var_Column,var_Column1,var_Columns,var_Items

oG2antt = form.EXG2ANTTCHARTACTIVEXCONTROL1.nativeObject
oG2antt.BeginUpdate()
oG2antt.LinesAtRoot = -1
oG2antt.DrawGridLines = -1
oG2antt.TreeColumnIndex = 0
oG2antt.MarkSearchColumn = false
oG2antt.FullRowSelect = 0
oG2antt.HeaderAppearance = -1 /*0xfffffff8 | Bump | Sunken*/
// oG2antt.Chart.PaneWidth(true) = 0
var_Chart = oG2antt.Chart
with (oG2antt)
	TemplateDef = [dim var_Chart]
	TemplateDef = var_Chart
	Template = [var_Chart.PaneWidth(True) = 0]
endwith
var_Columns = oG2antt.Columns
	// var_Columns.Add("C1").Width = 32
	var_Column = var_Columns.Add("C1")
	with (oG2antt)
		TemplateDef = [dim var_Column]
		TemplateDef = var_Column
		Template = [var_Column.Width = 32]
	endwith
	// var_Columns.Add("C2").FormatColumn = "1 index ``"
	var_Column1 = var_Columns.Add("C2")
	with (oG2antt)
		TemplateDef = [dim var_Column1]
		TemplateDef = var_Column1
		Template = [var_Column1.FormatColumn = "1 index ``"]
	endwith
var_Items = oG2antt.Items
	h = var_Items.AddItem("Cell 1")
	// var_Items.CellSingleLine(h,1) = false
	with (oG2antt)
		TemplateDef = [dim var_Items,h]
		TemplateDef = var_Items
		TemplateDef = h
		Template = [var_Items.CellSingleLine(h,1) = False]
	endwith
	h = var_Items.AddItem("This is bit of text merges all cells in the item (divider shows no +/-)")
	// var_Items.ItemDivider(h) = 0
	with (oG2antt)
		TemplateDef = [dim var_Items,h]
		TemplateDef = var_Items
		TemplateDef = h
		Template = [var_Items.ItemDivider(h) = 0]
	endwith
	// var_Items.ItemBackColor(h) = 0xf0f0f0
	with (oG2antt)
		TemplateDef = [dim var_Items,h]
		TemplateDef = var_Items
		TemplateDef = h
		Template = [var_Items.ItemBackColor(h) = 15790320]
	endwith
	// var_Items.ItemDividerLine(h) = 0
	with (oG2antt)
		TemplateDef = [dim var_Items,h]
		TemplateDef = var_Items
		TemplateDef = h
		Template = [var_Items.ItemDividerLine(h) = 0]
	endwith
	// var_Items.CellHAlignment(h,0) = 1
	with (oG2antt)
		TemplateDef = [dim var_Items,h]
		TemplateDef = var_Items
		TemplateDef = h
		Template = [var_Items.CellHAlignment(h,0) = 1]
	endwith
	var_Items.InsertItem(h,null,"Child 1")
	var_Items.InsertItem(h,null,"Child 2")
	// var_Items.ExpandItem(h) = true
	with (oG2antt)
		TemplateDef = [dim var_Items,h]
		TemplateDef = var_Items
		TemplateDef = h
		Template = [var_Items.ExpandItem(h) = True]
	endwith
	h = var_Items.AddItem("Cell 3")
	h = var_Items.AddItem("This is bit of text merges all cells in the item (merge shows +/-)")
	// var_Items.ItemBackColor(h) = 0xf0f0f0
	with (oG2antt)
		TemplateDef = [dim var_Items,h]
		TemplateDef = var_Items
		TemplateDef = h
		Template = [var_Items.ItemBackColor(h) = 15790320]
	endwith
	// var_Items.CellMerge(h,0) = 1
	with (oG2antt)
		TemplateDef = [dim var_Items,h]
		TemplateDef = var_Items
		TemplateDef = h
		Template = [var_Items.CellMerge(h,0) = 1]
	endwith
	var_Items.InsertItem(h,null,"Child 3")
	var_Items.InsertItem(h,null,"Child 4")
	// var_Items.ExpandItem(h) = true
	with (oG2antt)
		TemplateDef = [dim var_Items,h]
		TemplateDef = var_Items
		TemplateDef = h
		Template = [var_Items.ExpandItem(h) = True]
	endwith
oG2antt.EndUpdate()
|
|
2090
|
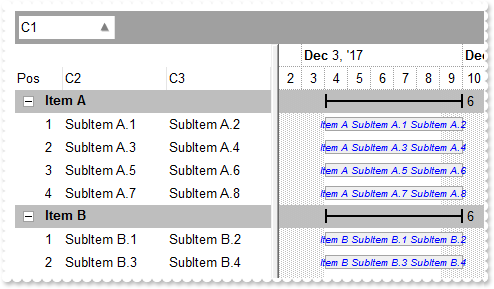
How can I display one or more columns on the same bar
/*
with (this.EXG2ANTTCHARTACTIVEXCONTROL1.nativeObject)
	AddGroupItem = class::nativeObject_AddGroupItem
endwith
*/
// Occurs after a new Group Item has been inserted to Items collection.
function nativeObject_AddGroupItem(Item)
	local l,var_Chart,var_Items
	oG2antt = form.EXG2ANTTCHARTACTIVEXCONTROL1.nativeObject
	var_Items = oG2antt.Items
		// var_Items.ItemDividerLine(Item) = 0
		with (oG2antt)
			TemplateDef = [dim var_Items,Item]
			TemplateDef = var_Items
			TemplateDef = Item
			Template = [var_Items.ItemDividerLine(Item) = 0]
		endwith
		var_Items.AddBar(Item,"Summary","12/02/2017","12/02/2017")
		var_Items.DefineSummaryBars(Item,"",-3,"")
		l = var_Items.GroupItem(Item)
		// var_Items.CellSingleLine(Item,l) = false
		with (oG2antt)
			TemplateDef = [dim var_Items,Item,l]
			TemplateDef = var_Items
			TemplateDef = Item
			TemplateDef = l
			Template = [var_Items.CellSingleLine(Item,l) = False]
		endwith
		// var_Items.CellBold(Item,l) = true
		with (oG2antt)
			TemplateDef = [dim var_Items,Item,l]
			TemplateDef = var_Items
			TemplateDef = Item
			TemplateDef = l
			Template = [var_Items.CellBold(Item,l) = True]
		endwith
		// var_Items.ItemBackColor(Item) = 0xbebebe
		with (oG2antt)
			TemplateDef = [dim var_Items,Item]
			TemplateDef = var_Items
			TemplateDef = Item
			Template = [var_Items.ItemBackColor(Item) = 12500670]
		endwith
	// oG2antt.Chart.ItemBackColor(Item) = 0xbebebe
	var_Chart = oG2antt.Chart
	with (oG2antt)
		TemplateDef = [dim var_Chart]
		TemplateDef = var_Chart
		Template = [var_Chart.ItemBackColor(Item) = 12500670]
	endwith
return

/*
with (this.EXG2ANTTCHARTACTIVEXCONTROL1.nativeObject)
	AddItem = class::nativeObject_AddItem
endwith
*/
// Occurs after a new Item has been inserted to Items collection.
function nativeObject_AddItem(Item)
	oG2antt = form.EXG2ANTTCHARTACTIVEXCONTROL1.nativeObject
	oG2antt.Items.AddBar(Item,"Task","12/04/2017","12/10/2017")
return

local h,oG2antt,var_Bar,var_Bar1,var_Chart,var_Column,var_Column1,var_Columns,var_Editor,var_Editor1,var_Items

oG2antt = form.EXG2ANTTCHARTACTIVEXCONTROL1.nativeObject
oG2antt.BeginUpdate()
oG2antt.VisualAppearance.Add(1,"gBFLBCJwBAEHhEJAAEhABOUGACAADACAxRDgMQBQKAAzAJBIYhiG4cYCgMZhXDOCYXABCEYRXBIZQ7BKNIxjSJwFgmEgADCMQwAFBIbhrE4ZBjHGQRUgyI43RhHUBzVIUBxDEaTZLlEYJBgeHYhDJPcaUVDcWQHGyeZwjSgpKoWSJIU5NcggPDgEwTKCmKlTAKoSzJMyEmwWRAdVTZLSEaxierKPhyWT/XgAF4PfDFKRXFqXY5mKZJFqKOI8TxINgxPQMGyrBqraLqKwQGrGCQKSBhUZ3dS2JR3OSlYRuQAMVgOXoDZhPWZXbDtSzPE63NgtOR5DiGWalABoeoxRa9cz3ViCJSrGTqIoINIzZLHFQbPpdAYdP6BeIjXhhZxBBuLZXmEOh9CcNoni2N4MjWVodh+DpfBeLJinsWR9AyYwVAkGBhEAFphGiRogDEGBamkFgtjcZgHiMbgehYaQhAIEIREAaQYkcQZUHIGRUGQDBOEaBAhDYDxGkMZAkCgeoagYZAYEYAYIAWGhemICIFj8WIiCiFR5gkIhogmBoKGKJx2C6C5hniMgggqYwog0UoNGMZJiDiCZRgOLY0ECUAQICA==")
var_Chart = oG2antt.Chart
	var_Chart.LevelCount = 2
	var_Chart.FirstVisibleDate = "12/02/2017"
	// var_Chart.PaneWidth(false) = 256
	with (oG2antt)
		TemplateDef = [dim var_Chart]
		TemplateDef = var_Chart
		Template = [var_Chart.PaneWidth(False) = 256]
	endwith
	var_Bar = var_Chart.Bars.Item("Summary")
		var_Bar.StartShape = 0
		var_Bar.EndShape = 0
		var_Bar.Shape = 1
		var_Bar.Color = 0x1000000
		// var_Bar.Def(3) = "<%=%513%>"
		with (oG2antt)
			TemplateDef = [dim var_Bar]
			TemplateDef = var_Bar
			Template = [var_Bar.Def(3) = "<%=%513%>"]
		endwith
		// var_Bar.Def(4) = 18
		with (oG2antt)
			TemplateDef = [dim var_Bar]
			TemplateDef = var_Bar
			Template = [var_Bar.Def(4) = 18]
		endwith
	var_Bar1 = var_Chart.Bars.Item("Task")
		var_Bar1.Pattern = 32
		var_Bar1.Color = 0xa4a4a4
		var_Bar1.StartColor = 0xf0f0f0
		var_Bar1.EndColor = var_Bar1.StartColor
		// var_Bar1.Def(3) = "<%= `<font ;6><fgcolor=0000FF><i>` + %C0 + ` ` + %C1 + ` ` + %C2 %>"
		with (oG2antt)
			TemplateDef = [dim var_Bar1]
			TemplateDef = var_Bar1
			Template = [var_Bar1.Def(3) = "<%= `<font ;6><fgcolor=0000FF><i>` + %C0 + ` ` + %C1 + ` ` + %C2 %>"]
		endwith
		// var_Bar1.Def(4) = 13
		with (oG2antt)
			TemplateDef = [dim var_Bar1]
			TemplateDef = var_Bar1
			Template = [var_Bar1.Def(4) = 13]
		endwith
var_Columns = oG2antt.Columns
	var_Columns.Add("C1")
	// var_Columns.Add("C2").Editor.EditType = 1
	var_Editor = var_Columns.Add("C2").Editor
	with (oG2antt)
		TemplateDef = [dim var_Editor]
		TemplateDef = var_Editor
		Template = [var_Editor.EditType = 1]
	endwith
	// var_Columns.Add("C3").Editor.EditType = 1
	var_Editor1 = var_Columns.Add("C3").Editor
	with (oG2antt)
		TemplateDef = [dim var_Editor1]
		TemplateDef = var_Editor1
		Template = [var_Editor1.EditType = 1]
	endwith
	var_Column = var_Columns.Add("Pos")
		var_Column.FormatColumn = "1 pos ``"
		var_Column.AllowGroupBy = false
		var_Column.Position = 0
		var_Column.Width = 48
		var_Column.AllowSizing = false
oG2antt.SortBarVisible = true
oG2antt.SortBarCaption = "Drag a <b>column</b> header here to group by that column."
oG2antt.AllowGroupBy = true
oG2antt.HasLines = 0
oG2antt.LinesAtRoot = 0
var_Items = oG2antt.Items
	h = var_Items.AddItem("Item A")
	// var_Items.CellValue(h,1) = "SubItem A.1"
	with (oG2antt)
		TemplateDef = [dim var_Items,h]
		TemplateDef = var_Items
		TemplateDef = h
		Template = [var_Items.CellValue(h,1) = "SubItem A.1"]
	endwith
	// var_Items.CellValue(h,2) = "SubItem A.2"
	with (oG2antt)
		TemplateDef = [dim var_Items,h]
		TemplateDef = var_Items
		TemplateDef = h
		Template = [var_Items.CellValue(h,2) = "SubItem A.2"]
	endwith
	h = var_Items.AddItem("Item A")
	// var_Items.CellValue(h,1) = "SubItem A.3"
	with (oG2antt)
		TemplateDef = [dim var_Items,h]
		TemplateDef = var_Items
		TemplateDef = h
		Template = [var_Items.CellValue(h,1) = "SubItem A.3"]
	endwith
	// var_Items.CellValue(h,2) = "SubItem A.4"
	with (oG2antt)
		TemplateDef = [dim var_Items,h]
		TemplateDef = var_Items
		TemplateDef = h
		Template = [var_Items.CellValue(h,2) = "SubItem A.4"]
	endwith
	h = var_Items.AddItem("Item A")
	// var_Items.CellValue(h,1) = "SubItem A.5"
	with (oG2antt)
		TemplateDef = [dim var_Items,h]
		TemplateDef = var_Items
		TemplateDef = h
		Template = [var_Items.CellValue(h,1) = "SubItem A.5"]
	endwith
	// var_Items.CellValue(h,2) = "SubItem A.6"
	with (oG2antt)
		TemplateDef = [dim var_Items,h]
		TemplateDef = var_Items
		TemplateDef = h
		Template = [var_Items.CellValue(h,2) = "SubItem A.6"]
	endwith
	h = var_Items.AddItem("Item A")
	// var_Items.CellValue(h,1) = "SubItem A.7"
	with (oG2antt)
		TemplateDef = [dim var_Items,h]
		TemplateDef = var_Items
		TemplateDef = h
		Template = [var_Items.CellValue(h,1) = "SubItem A.7"]
	endwith
	// var_Items.CellValue(h,2) = "SubItem A.8"
	with (oG2antt)
		TemplateDef = [dim var_Items,h]
		TemplateDef = var_Items
		TemplateDef = h
		Template = [var_Items.CellValue(h,2) = "SubItem A.8"]
	endwith
	h = var_Items.AddItem("Item B")
	// var_Items.CellValue(h,1) = "SubItem B.1"
	with (oG2antt)
		TemplateDef = [dim var_Items,h]
		TemplateDef = var_Items
		TemplateDef = h
		Template = [var_Items.CellValue(h,1) = "SubItem B.1"]
	endwith
	// var_Items.CellValue(h,2) = "SubItem B.2"
	with (oG2antt)
		TemplateDef = [dim var_Items,h]
		TemplateDef = var_Items
		TemplateDef = h
		Template = [var_Items.CellValue(h,2) = "SubItem B.2"]
	endwith
	h = var_Items.AddItem("Item B")
	// var_Items.CellValue(h,1) = "SubItem B.3"
	with (oG2antt)
		TemplateDef = [dim var_Items,h]
		TemplateDef = var_Items
		TemplateDef = h
		Template = [var_Items.CellValue(h,1) = "SubItem B.3"]
	endwith
	// var_Items.CellValue(h,2) = "SubItem B.4"
	with (oG2antt)
		TemplateDef = [dim var_Items,h]
		TemplateDef = var_Items
		TemplateDef = h
		Template = [var_Items.CellValue(h,2) = "SubItem B.4"]
	endwith
var_Column1 = oG2antt.Columns.Item(0)
	var_Column1.SortOrder = 1
oG2antt.EndUpdate()
|
|
2089
|
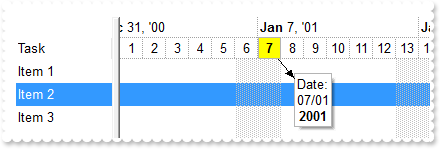
How can I associate a box/note to a date into the control's header
local hLocked,oG2antt,var_Chart,var_Items,var_Items1,var_Note,var_Notes

oG2antt = form.EXG2ANTTCHARTACTIVEXCONTROL1.nativeObject
oG2antt.BeginUpdate()
oG2antt.ScrollBySingleLine = true
oG2antt.Columns.Add("Task")
oG2antt.HeaderHeight = 17
var_Chart = oG2antt.Chart
	var_Chart.FirstVisibleDate = "01/01/2001"
	// var_Chart.PaneWidth(false) = 96
	with (oG2antt)
		TemplateDef = [dim var_Chart]
		TemplateDef = var_Chart
		Template = [var_Chart.PaneWidth(False) = 96]
	endwith
	var_Chart.LevelCount = 2
	var_Chart.SelBackColor = oG2antt.SelBackColor
var_Items = oG2antt.Items
	var_Items.AddItem("Item 1")
	// var_Items.SelectItem(var_Items.AddItem("Item 2")) = true
	with (oG2antt)
		TemplateDef = [dim var_Items]
		TemplateDef = var_Items
		Template = [var_Items.SelectItem(AddItem("Item 2")) = True]
	endwith
	var_Items.AddItem("Item 3")
var_Notes = oG2antt.Chart.Notes
	var_Items1 = oG2antt.Items
		// var_Items1.LockedItemCount(0) = 1
		with (oG2antt)
			TemplateDef = [dim var_Items1]
			TemplateDef = var_Items1
			Template = [var_Items1.LockedItemCount(0) = 1]
		endwith
		hLocked = var_Items1.LockedItem(0,0)
		// var_Items1.ItemHeight(hLocked) = 1
		with (oG2antt)
			TemplateDef = [dim var_Items1,hLocked]
			TemplateDef = var_Items1
			TemplateDef = hLocked
			Template = [var_Items1.ItemHeight(hLocked) = 1]
		endwith
	var_Note = var_Notes.Add("header",hLocked,"01/07/2001","Date:<br><%dd%>/<%mm%><br><b><%yyyy%></b>")
		// var_Note.PartVisible(0) = true
		with (oG2antt)
			TemplateDef = [dim var_Note]
			TemplateDef = var_Note
			Template = [var_Note.PartVisible(0) = True]
		endwith
		// var_Note.PartText(0) = "<b><%d%></b>"
		with (oG2antt)
			TemplateDef = [dim var_Note]
			TemplateDef = var_Note
			Template = [var_Note.PartText(0) = "<b><%d%></b>"]
		endwith
		// var_Note.PartCanMove(1) = true
		with (oG2antt)
			TemplateDef = [dim var_Note]
			TemplateDef = var_Note
			Template = [var_Note.PartCanMove(1) = True]
		endwith
		// var_Note.PartCanMove(0) = true
		with (oG2antt)
			TemplateDef = [dim var_Note]
			TemplateDef = var_Note
			Template = [var_Note.PartCanMove(0) = True]
		endwith
		// var_Note.PartVOffset(0) = -9
		with (oG2antt)
			TemplateDef = [dim var_Note]
			TemplateDef = var_Note
			Template = [var_Note.PartVOffset(0) = -9]
		endwith
		// var_Note.PartVOffset(1) = 20
		with (oG2antt)
			TemplateDef = [dim var_Note]
			TemplateDef = var_Note
			Template = [var_Note.PartVOffset(1) = 20]
		endwith
		// var_Note.PartHOffset(1) = 20
		with (oG2antt)
			TemplateDef = [dim var_Note]
			TemplateDef = var_Note
			Template = [var_Note.PartHOffset(1) = 20]
		endwith
		// var_Note.PartBackColor(0) = 0xffff
		with (oG2antt)
			TemplateDef = [dim var_Note]
			TemplateDef = var_Note
			Template = [var_Note.PartBackColor(0) = 65535]
		endwith
		// var_Note.PartFixedWidth(0) = 18
		with (oG2antt)
			TemplateDef = [dim var_Note]
			TemplateDef = var_Note
			Template = [var_Note.PartFixedWidth(0) = 18]
		endwith
oG2antt.EndUpdate()
|
|
2088
|
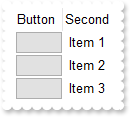
How can I define a column of button type
/*
with (this.EXG2ANTTCHARTACTIVEXCONTROL1.nativeObject)
	ButtonClick = class::nativeObject_ButtonClick
endwith
*/
// Occurs when user clicks on the cell's button.
function nativeObject_ButtonClick(Item, ColIndex, Key)
	local var_Items
	oG2antt = form.EXG2ANTTCHARTACTIVEXCONTROL1.nativeObject
	var_Items = oG2antt.Items
		? Str(var_Items.CellValue(Item,ColIndex))
return

local oG2antt,var_Column,var_Column1,var_Items

oG2antt = form.EXG2ANTTCHARTACTIVEXCONTROL1.nativeObject
oG2antt.BeginUpdate()
var_Column = oG2antt.Columns.Add("Button")
	// var_Column.Def(2) = true
	with (oG2antt)
		TemplateDef = [dim var_Column]
		TemplateDef = var_Column
		Template = [var_Column.Def(2) = True]
	endwith
	// var_Column.Def(3) = false
	with (oG2antt)
		TemplateDef = [dim var_Column]
		TemplateDef = var_Column
		Template = [var_Column.Def(3) = False]
	endwith
	var_Column.FormatColumn = "``"
	var_Column.AllowSizing = false
	var_Column.Width = 48
// oG2antt.Columns.Add("Second").FormatColumn = "` Item ` + 1 index ``"
var_Column1 = oG2antt.Columns.Add("Second")
with (oG2antt)
	TemplateDef = [dim var_Column1]
	TemplateDef = var_Column1
	Template = [var_Column1.FormatColumn = "` Item ` + 1 index ``"]
endwith
var_Items = oG2antt.Items
	var_Items.AddItem("Button 1")
	var_Items.AddItem("Button 2")
	var_Items.AddItem("Button 3 ")
oG2antt.EndUpdate()
|
|
2087
|
Is it possible to configure different colour/icon when there is a active filter
/*
with (this.EXG2ANTTCHARTACTIVEXCONTROL1.nativeObject)
	FilterChange = class::nativeObject_FilterChange
endwith
*/
// Occurs when the filter was changed.
function nativeObject_FilterChange()
	oG2antt = form.EXG2ANTTCHARTACTIVEXCONTROL1.nativeObject
	oG2antt.Template = [Background(0) = FormatABC("value = 0 ? 0x1000001 : 0x10000FF ",Columns.Item(0).FilterType)] // oG2antt.Background(0) = oG2antt.FormatABC("value = 0 ? 0x1000001 : 0x10000FF ",oG2antt.Columns.Item(0).FilterType)
return

local oG2antt,var_Appearance,var_Column,var_Column1,var_Items

oG2antt = form.EXG2ANTTCHARTACTIVEXCONTROL1.nativeObject
oG2antt.BeginUpdate()
var_Appearance = oG2antt.VisualAppearance
	var_Appearance.RenderType = -16777216
	var_Appearance.Add(1,"gBFLBCJwBAEHhEJAAEhABXUIQAAYAQGKIcBiAKBQAGYBIJDEMgzDDAUBjKKocQTC4AIQjCK4JDKHYJRpHEZyCA8EhqGASRAFUQBYiWE4oSpLABQaK0ZwIGyRIrkGQgQgmPYDSDNU4zVIEEglBI0TDNczhNDENgtGYaJqHIYpZBcM40TKkEZoSIITZcRrOEBiRL1S0RBhGcRUHZlWzdN64LhuK47UrWdD/XhdVzXRbjfz1Oq+bxve48Br7A5yYThdr4LhOFQ3RjIL4xbIcUwGe6VZhjOLZXjmO49T69HTtOCYBEBA")
oG2antt.DrawGridLines = -1
oG2antt.ShowFocusRect = false
oG2antt.Template = [Background(0) = 16777217] // oG2antt.Background(0) = 0x1000001
oG2antt.Template = [Background(32) = -1] // oG2antt.Background(32) = -1
oG2antt.HeaderAppearance = 4
oG2antt.BackColorHeader = 0xffffff
oG2antt.HeaderVisible = 1
var_Column = oG2antt.Columns.Add("Filter")
	var_Column.DisplayFilterButton = true
	var_Column.AllowSort = false
	var_Column.AllowDragging = false
	var_Column.FilterList = 256
var_Items = oG2antt.Items
	var_Items.AddItem("Item A")
	var_Items.AddItem("Item B")
	var_Items.AddItem("Item C")
var_Column1 = oG2antt.Columns.Item(0)
	var_Column1.Filter = "Item B"
	var_Column1.FilterType = 240
oG2antt.ApplyFilter()
oG2antt.EndUpdate()
|
|
2086
|
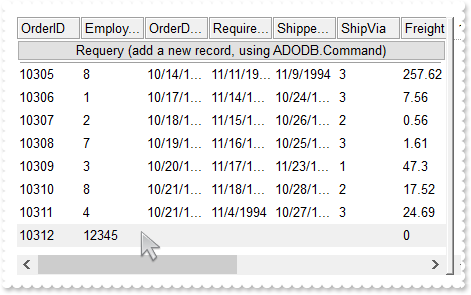
ADODB Requery sample
/*
with (this.EXG2ANTTCHARTACTIVEXCONTROL1.nativeObject)
	ButtonClick = class::nativeObject_ButtonClick
endwith
*/
// Occurs when user clicks on the cell's button.
function nativeObject_ButtonClick(Item, ColIndex, Key)
	local cmd
	oG2antt = form.EXG2ANTTCHARTACTIVEXCONTROL1.nativeObject
	cmd = new OleAutoClient("ADODB.Command")
		cmd.ActiveConnection = oG2antt.DataSource.ActiveConnection
		cmd.CommandText = "INSERT INTO Orders (EmployeeID) VALUES(12345)"
		cmd.CommandType = 1
		cmd.Execute()
	oG2antt.DataSource.Requery()
return

/*
with (this.EXG2ANTTCHARTACTIVEXCONTROL1.nativeObject)
	Error = class::nativeObject_Error
endwith
*/
// Fired when an internal error occurs.
function nativeObject_Error(Error, Description)
	oG2antt = form.EXG2ANTTCHARTACTIVEXCONTROL1.nativeObject
	? Str(Description)
return

local h,oG2antt,rs,var_ConditionalFormat,var_Items

oG2antt = form.EXG2ANTTCHARTACTIVEXCONTROL1.nativeObject
oG2antt.BeginUpdate()
oG2antt.HeaderAppearance = 4
oG2antt.ColumnAutoResize = false
rs = new OleAutoClient("ADODB.Recordset")
	rs.Open("Select * From Orders","Provider=Microsoft.ACE.OLEDB.12.0;Data Source=C:\Program Files\Exontrol\ExG2antt\Sample\Access\misc.accdb",1,3)
oG2antt.DataSource = rs
// oG2antt.ConditionalFormats.Add("%1=12345").BackColor = 0xf0f0f0
var_ConditionalFormat = oG2antt.ConditionalFormats.Add("%1=12345")
with (oG2antt)
	TemplateDef = [dim var_ConditionalFormat]
	TemplateDef = var_ConditionalFormat
	Template = [var_ConditionalFormat.BackColor = 15790320]
endwith
var_Items = oG2antt.Items
	// var_Items.LockedItemCount(0) = 1
	with (oG2antt)
		TemplateDef = [dim var_Items]
		TemplateDef = var_Items
		Template = [var_Items.LockedItemCount(0) = 1]
	endwith
	h = var_Items.LockedItem(0,0)
	// var_Items.ItemDivider(h) = 0
	with (oG2antt)
		TemplateDef = [dim var_Items,h]
		TemplateDef = var_Items
		TemplateDef = h
		Template = [var_Items.ItemDivider(h) = 0]
	endwith
	// var_Items.CellHasButton(h,0) = true
	with (oG2antt)
		TemplateDef = [dim var_Items,h]
		TemplateDef = var_Items
		TemplateDef = h
		Template = [var_Items.CellHasButton(h,0) = True]
	endwith
	// var_Items.CellValue(h,0) = "Requery (add a new record, using ADODB.Command)"
	with (oG2antt)
		TemplateDef = [dim var_Items,h]
		TemplateDef = var_Items
		TemplateDef = h
		Template = [var_Items.CellValue(h,0) = "Requery (add a new record, using ADODB.Command)"]
	endwith
	// var_Items.CellHAlignment(h,0) = 1
	with (oG2antt)
		TemplateDef = [dim var_Items,h]
		TemplateDef = var_Items
		TemplateDef = h
		Template = [var_Items.CellHAlignment(h,0) = 1]
	endwith
oG2antt.EndUpdate()
|
|
2085
|
I am skinning the control's header-bar, but the background of the header-bar is shown on each item in the filter-bar drop down panel. What can I do
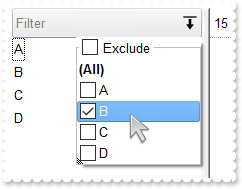
local oG2antt,var_Appearance,var_Column,var_Items

oG2antt = form.EXG2ANTTCHARTACTIVEXCONTROL1.nativeObject
oG2antt.BeginUpdate()
var_Appearance = oG2antt.VisualAppearance
	var_Appearance.Add(1,"gBFLBCJwBAEHhEJAAEhABFgDg6AADACAxRDgMQBQKAAzQFAYcBqGqGAAGQZxYgmFgAQhFcZQSKUOQTDKMIziYBYfgkMIgSbJUgDGAkRRdDSOYDmGQYDiCIoRShOMIjHLUXxtDaIZwhEAoJb+RgAUY/cTzaAEUwHHiTKInaCQGhsCYJUJAdRURQ9EwvCIZBpEWwLChENQwWLCNj2TScBwjCyqbale45ViqdoDU8lORLUi+M4zSBPcZVTRtGShPDBKTjMKKYgkG4lVpRNa0PC1GTzQ6mazkKQLRADDIDVbAeL3LiMBy9LyLLItQALByua5mWhbcZyBCOPgBTrRb5zO58FjuTK7YLjMB7NrUNYtFaUMy2OpOCADIaecTNcaWLxPF2MY1HWYxVj2Jw3DuRJonKYBgggSRAlIYw6B0ThGFgPAkFUDAhBMfZRiGNAkFECZnm4YQdneJwqnsSQrGAAhWAIJBJBIQgFCQIBiEIAglgqYo0i4V4MEgRI9gSToYFSb4Fk6Y4+BmBZhFOJgTC8TBogQAArgqco4muCZOkOMJtgmYpIjYKg7GKE4uCUK4AAKKg2DwI4DiCZw5k6KJ2D6D4OHiag4DwIxiiQAArAqMosnEPBPAOIhOg+DozjIJ4PGSY4iEwPAkhKLhHUUSQsnKFCnkYU9MjORhcCsAAIACLQ8iaSJ6FKC5jJoaobA8KYoACCRKnmMJzhuDpZnSboMCKGJ4nMPIPDmYAACwKIDk6CoLCeU40m6I5oliMoKDya" ;
	 +"ICokLIpgoThviOKJoGYf4KmUKhMjMLJLCAAojCyaYoiYGoGmqM46CkOwPEoKonAACxKlSdItmiWBeBeDgrioNo3D0KxSlAAAtgsUpYnUPRPEoco8hCa+T40SxbBRj5tEsHJ1i6JhbGYS4ug8awelQLZAAKZI5C4DxrhYQ9ehmUppWiA48nAPRuFKYpiAAC47laZQ9iuKZSgOPotkuFI7C6C4gACPJAm8eQOhOQZoikDp3kCS5AACPoEk8fBGnqQgpDOSppD2TxjlyPZD6CfwekQTx5lKP5ImseZTCAL5MAMAAAkoTADmMLpIjISp+HSS4PgyMAADBzAHDSIoPCOUpWjObIKE8NJOHKIwPEaTprBsHpdjWLB9AieQ+DQYwQAAMR1EOZxWi+bx7HcWQ8msfRYnnDhQACRwxgwc5rGaMZPE0ZxqjWNZtgyRwAAyTZEnuXJzEyAx2kQcxNkye5cEy3cYAcANrGAIH4OAhx3gNGGPAfgIR8jBA4McBMARViHH4HQOYmxuCpF2MsecEQVBvGQCcIQvA6i2CAAIARAQ=")
	var_Appearance.Add(2,"gBFLBCJwBAEHhEJAAEhABZEGACAADACAxRDgMQBQKAAzQFAYcBqGqGAAGQZxYgmFgAQhFcZQSKUOQTDKMIziYBYJhEMwwDhEIwjHCEEhsGIbJAGQBJCjWGodQLOEgzNC0IxNFCQILhEZJADKII8TTOU5UPRESwTE4cKBmKhQCo2NpKR7VUTxCKQahLLivoCjBT8EzHMqtIzrCA6MpaP4pQjKcqwHJ8YyHEi0ZrjazKaj6T5AXDUcaWbbNVx3PK3aioOpLZrqOZZYzYFoABTuJzPMSyIhxXD8cweaZvSpLExVYK9BY3PbKMgxC77QgTIpDaQMNS6PjtF43PAALLFUaNYzoOKzABMHATBIXAYJCwIIR5G7ID4BbQcCQAHL9DBaEEIAEEISgGhMGZQmocgymmIRQkIEQ2BcGgbEIRQci8XaMBqTRVgSAZHG+S5pnOep+D6f4vjec5zn0fpfmgBgAH6TRoBYBoAh+eAmAiAgPFgNArgOQpIESdoEmCOAOAqBYfFGAgaEaBgYHYFYFmIB5UiGCJUgKCgmgeYoHk4BgCmKRQiCwApgHgYgyH8B54lQU4NkMeJlBoDgjkiXBTg0R54iYIR+koeQVBoKpkgkChKhEJBkF4SFEjkDgJhFQoeEmDJlBeehUhWJQJGIXoICWOQ6FeFIlhkfhlDsSJpiQVoamaSY2G6G5nAmRhpCOH5pkwVYdmeCZmHqHpnkmdhzhmaAIFiax8AABAEICA==")
oG2antt.BackColorHeader = 0x1000000
oG2antt.ForeColorHeader = 0x808080
oG2antt.Template = [Background(0) = 33554432] // oG2antt.Background(0) = 0x2000000
oG2antt.Template = [Background(26) = 16777215] // oG2antt.Background(26) = 0xffffff
oG2antt.Template = [Background(27) = 65536] // oG2antt.Background(27) = 0x10000
oG2antt.Template = [Background(20) = 33521664] // oG2antt.Background(20) = 0x1ff8000
oG2antt.Template = [Background(21) = 15790320] // oG2antt.Background(21) = 0xf0f0f0
oG2antt.Template = [Background(32) = -1] // oG2antt.Background(32) = -1
oG2antt.HeaderHeight = 24
oG2antt.BackColorLevelHeader = oG2antt.BackColor
var_Column = oG2antt.Columns.Add("Filter")
	var_Column.DisplayFilterButton = true
	var_Column.DisplayFilterPattern = false
	var_Column.FilterList = 9504 /*exShowExclude | exShowFocusItem | exShowCheckBox | exSortItemsAsc*/
	// var_Column.Def(52) = 2
	with (oG2antt)
		TemplateDef = [dim var_Column]
		TemplateDef = var_Column
		Template = [var_Column.Def(52) = 2]
	endwith
	// var_Column.Def(53) = 2
	with (oG2antt)
		TemplateDef = [dim var_Column]
		TemplateDef = var_Column
		Template = [var_Column.Def(53) = 2]
	endwith
var_Items = oG2antt.Items
	var_Items.AddItem("A")
	var_Items.AddItem("B")
	var_Items.AddItem("C")
	var_Items.AddItem("D")
oG2antt.EndUpdate()
|
|
2084
|
I specify the ItemHeight for each row, but as soon as I click the chart section, the item's height is restored to default (not working). What could be the cause
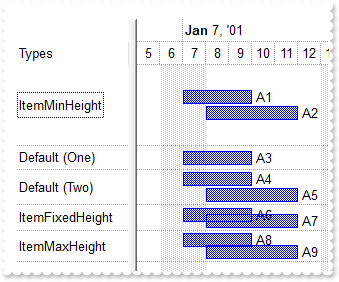
local h,oG2antt,var_Bar,var_Chart,var_Items

oG2antt = form.EXG2ANTTCHARTACTIVEXCONTROL1.nativeObject
oG2antt.BeginUpdate()
oG2antt.ScrollBySingleLine = true
oG2antt.Columns.Add("Types")
oG2antt.DrawGridLines = 1
var_Chart = oG2antt.Chart
	var_Chart.LevelCount = 2
	var_Chart.DrawGridLines = 1
	var_Chart.AllowCreateBar = 1
	var_Chart.AllowLinkBars = false
	var_Chart.ResizeUnitScale = 65536
	// var_Chart.PaneWidth(false) = 112
	with (oG2antt)
		TemplateDef = [dim var_Chart]
		TemplateDef = var_Chart
		Template = [var_Chart.PaneWidth(False) = 112]
	endwith
	var_Chart.FirstVisibleDate = "01/01/2001"
	var_Bar = var_Chart.Bars.Item("Task")
		var_Bar.OverlaidType = 3
		// var_Bar.Def(3) = "<%=%9%>"
		with (oG2antt)
			TemplateDef = [dim var_Bar]
			TemplateDef = var_Bar
			Template = [var_Bar.Def(3) = "<%=%9%>"]
		endwith
		// var_Bar.Def(4) = 18
		with (oG2antt)
			TemplateDef = [dim var_Bar]
			TemplateDef = var_Bar
			Template = [var_Bar.Def(4) = 18]
		endwith
var_Items = oG2antt.Items
	h = var_Items.AddItem("ItemMinHeight")
	var_Items.AddBar(h,"Task","01/07/2001","01/10/2001","A1")
	var_Items.AddBar(h,"Task","01/08/2001","01/12/2001","A2")
	// var_Items.ItemMinHeight(h) = 64
	with (oG2antt)
		TemplateDef = [dim var_Items,h]
		TemplateDef = var_Items
		TemplateDef = h
		Template = [var_Items.ItemMinHeight(h) = 64]
	endwith
	var_Items.AddBar(var_Items.AddItem("Default (One)"),"Task","01/07/2001","01/10/2001","A3")
	h = var_Items.AddItem("Default (Two)")
	var_Items.AddBar(h,"Task","01/07/2001","01/10/2001","A4")
	var_Items.AddBar(h,"Task","01/08/2001","01/12/2001","A5")
	h = var_Items.AddItem("ItemFixedHeight")
	var_Items.AddBar(h,"Task","01/07/2001","01/10/2001","A6")
	var_Items.AddBar(h,"Task","01/08/2001","01/12/2001","A7")
	// var_Items.ItemMinHeight(h) = 20
	with (oG2antt)
		TemplateDef = [dim var_Items,h]
		TemplateDef = var_Items
		TemplateDef = h
		Template = [var_Items.ItemMinHeight(h) = 20]
	endwith
	// var_Items.ItemMaxHeight(h) = 20
	with (oG2antt)
		TemplateDef = [dim var_Items,h]
		TemplateDef = var_Items
		TemplateDef = h
		Template = [var_Items.ItemMaxHeight(h) = 20]
	endwith
	h = var_Items.AddItem("ItemMaxHeight")
	var_Items.AddBar(h,"Task","01/07/2001","01/10/2001","A8")
	var_Items.AddBar(h,"Task","01/08/2001","01/12/2001","A9")
	// var_Items.ItemMaxHeight(h) = 24
	with (oG2antt)
		TemplateDef = [dim var_Items,h]
		TemplateDef = var_Items
		TemplateDef = h
		Template = [var_Items.ItemMaxHeight(h) = 24]
	endwith
oG2antt.EndUpdate()
|
|
2083
|
The ItemHeight property is not working (method 2)
local h,oG2antt,var_Column,var_Items
oG2antt = form.EXG2ANTTCHARTACTIVEXCONTROL1.nativeObject
oG2antt.BeginUpdate()
oG2antt.ColumnAutoResize = false
oG2antt.ScrollBySingleLine = true
// oG2antt.Columns.Add("Column").Width = 128
var_Column = oG2antt.Columns.Add("Column")
with (oG2antt)
TemplateDef = [dim var_Column]
TemplateDef = var_Column
Template = [var_Column.Width = 128]
endwith
var_Items = oG2antt.Items
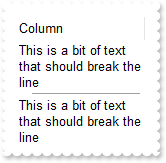
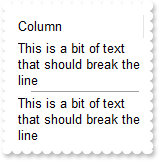
// var_Items.CellSingleLine(var_Items.AddItem("This is a bit of text that should break the line"),0) = 0
with (oG2antt)
TemplateDef = [dim var_Items]
TemplateDef = var_Items
Template = [var_Items.CellSingleLine(AddItem("This is a bit of text that should break the line"),0) = 0]
endwith
h = var_Items.AddItem("")
// var_Items.ItemDivider(h) = 0
with (oG2antt)
TemplateDef = [dim var_Items,h]
TemplateDef = var_Items
TemplateDef = h
Template = [var_Items.ItemDivider(h) = 0]
endwith
// var_Items.SelectableItem(h) = false
with (oG2antt)
TemplateDef = [dim var_Items,h]
TemplateDef = var_Items
TemplateDef = h
Template = [var_Items.SelectableItem(h) = False]
endwith
// var_Items.ItemDividerLineAlignment(h) = 1
with (oG2antt)
TemplateDef = [dim var_Items,h]
TemplateDef = var_Items
TemplateDef = h
Template = [var_Items.ItemDividerLineAlignment(h) = 1]
endwith
// var_Items.ItemHeight(h) = 3
with (oG2antt)
TemplateDef = [dim var_Items,h]
TemplateDef = var_Items
TemplateDef = h
Template = [var_Items.ItemHeight(h) = 3]
endwith
// var_Items.CellSingleLine(var_Items.AddItem("This is a bit of text that should break the line"),0) = 0
with (oG2antt)
TemplateDef = [dim var_Items]
TemplateDef = var_Items
Template = [var_Items.CellSingleLine(AddItem("This is a bit of text that should break the line"),0) = 0]
endwith
oG2antt.EndUpdate()
|
|
2082
|
The ItemHeight property is not working (method 1)
local h,oG2antt,var_Column,var_Items

oG2antt = form.EXG2ANTTCHARTACTIVEXCONTROL1.nativeObject
oG2antt.BeginUpdate()
oG2antt.ColumnAutoResize = false
oG2antt.ScrollBySingleLine = true
var_Column = oG2antt.Columns.Add("Column")
	var_Column.Width = 128
	// var_Column.Def(16) = 0
	with (oG2antt)
		TemplateDef = [dim var_Column]
		TemplateDef = var_Column
		Template = [var_Column.Def(16) = 0]
	endwith
var_Items = oG2antt.Items
	var_Items.AddItem("This is a bit of text that should break the line")
	h = var_Items.AddItem("")
	// var_Items.ItemDivider(h) = 0
	with (oG2antt)
		TemplateDef = [dim var_Items,h]
		TemplateDef = var_Items
		TemplateDef = h
		Template = [var_Items.ItemDivider(h) = 0]
	endwith
	// var_Items.SelectableItem(h) = false
	with (oG2antt)
		TemplateDef = [dim var_Items,h]
		TemplateDef = var_Items
		TemplateDef = h
		Template = [var_Items.SelectableItem(h) = False]
	endwith
	// var_Items.ItemDividerLineAlignment(h) = 1
	with (oG2antt)
		TemplateDef = [dim var_Items,h]
		TemplateDef = var_Items
		TemplateDef = h
		Template = [var_Items.ItemDividerLineAlignment(h) = 1]
	endwith
	// var_Items.ItemMinHeight(h) = 3
	with (oG2antt)
		TemplateDef = [dim var_Items,h]
		TemplateDef = var_Items
		TemplateDef = h
		Template = [var_Items.ItemMinHeight(h) = 3]
	endwith
	// var_Items.ItemMaxHeight(h) = 3
	with (oG2antt)
		TemplateDef = [dim var_Items,h]
		TemplateDef = var_Items
		TemplateDef = h
		Template = [var_Items.ItemMaxHeight(h) = 3]
	endwith
	var_Items.AddItem("This is a bit of text that should break the line")
oG2antt.EndUpdate()
|
|
2081
|
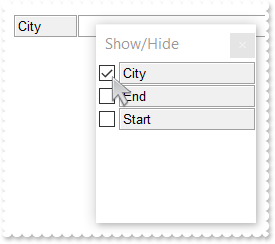
How do I use the ColumnsFloatBarVisible on exColumnsFloatBarVisibleIncludeCheckColumns
local oG2antt,var_Column,var_Column1,var_Columns

oG2antt = form.EXG2ANTTCHARTACTIVEXCONTROL1.nativeObject
oG2antt.BeginUpdate()
oG2antt.ColumnAutoResize = false
oG2antt.HeaderAppearance = 4
var_Columns = oG2antt.Columns
	var_Columns.Add("City")
	// var_Columns.Add("Start").Visible = false
	var_Column = var_Columns.Add("Start")
	with (oG2antt)
		TemplateDef = [dim var_Column]
		TemplateDef = var_Column
		Template = [var_Column.Visible = False]
	endwith
	// var_Columns.Add("End").Visible = false
	var_Column1 = var_Columns.Add("End")
	with (oG2antt)
		TemplateDef = [dim var_Column1]
		TemplateDef = var_Column1
		Template = [var_Column1.Visible = False]
	endwith
oG2antt.Template = [Description(26) = "Show/Hide"] // oG2antt.Description(26) = "Show/Hide"
oG2antt.ColumnsFloatBarSortOrder = 1
oG2antt.ColumnsFloatBarVisible = 2
oG2antt.EndUpdate()
|
|
2080
|
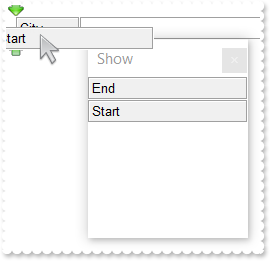
How do I use the ColumnsFloatBarVisible on exColumnsFloatBarVisibleIncludeHiddenColumn
local oG2antt,var_Column,var_Column1,var_Columns

oG2antt = form.EXG2ANTTCHARTACTIVEXCONTROL1.nativeObject
oG2antt.BeginUpdate()
oG2antt.ColumnAutoResize = false
oG2antt.HeaderAppearance = 4
var_Columns = oG2antt.Columns
	var_Columns.Add("City")
	// var_Columns.Add("Start").Visible = false
	var_Column = var_Columns.Add("Start")
	with (oG2antt)
		TemplateDef = [dim var_Column]
		TemplateDef = var_Column
		Template = [var_Column.Visible = False]
	endwith
	// var_Columns.Add("End").Visible = false
	var_Column1 = var_Columns.Add("End")
	with (oG2antt)
		TemplateDef = [dim var_Column1]
		TemplateDef = var_Column1
		Template = [var_Column1.Visible = False]
	endwith
oG2antt.Template = [Description(26) = "Show"] // oG2antt.Description(26) = "Show"
oG2antt.ColumnsFloatBarVisible = -1
oG2antt.ColumnsFloatBarSortOrder = 1
oG2antt.EndUpdate()
|
|
2079
|
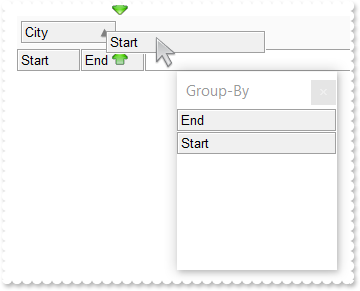
How do I use the ColumnsFloatBarVisible on exColumnsFloatBarVisibleIncludeGroupByColumns
local oG2antt,var_Columns

oG2antt = form.EXG2ANTTCHARTACTIVEXCONTROL1.nativeObject
oG2antt.BeginUpdate()
oG2antt.ColumnAutoResize = false
oG2antt.HeaderAppearance = 4
var_Columns = oG2antt.Columns
	var_Columns.Add("City")
	var_Columns.Add("Start")
	var_Columns.Add("End")
oG2antt.AllowGroupBy = true
oG2antt.SortBarVisible = true
oG2antt.SortBarCaption = "Drag a <b>column</b> header here to group by that column."
oG2antt.BackColorSortBar = 0xfafafa
oG2antt.Template = [Description(26) = "Group-By"] // oG2antt.Description(26) = "Group-By"
oG2antt.ColumnsFloatBarVisible = 1
oG2antt.ColumnsFloatBarSortOrder = 1
oG2antt.Columns.Item("City").SortOrder = 1
oG2antt.EndUpdate()
|
|
2078
|
How can I advance to the next line, once the user presses the ENTER key
/*
with (this.EXG2ANTTCHARTACTIVEXCONTROL1.nativeObject)
	KeyDown = class::nativeObject_KeyDown
endwith
*/
// Occurs when the user presses a key while an object has the focus.
function nativeObject_KeyDown(KeyCode, Shift)
	oG2antt = form.EXG2ANTTCHARTACTIVEXCONTROL1.nativeObject
	? "KeyCode Before:"
	? Str(KeyCode)
	KeyCode = oG2antt.FormatABC("value = 13 ? 40 : value",KeyCode)
	? "KeyCode After:"
	? Str(KeyCode)
return

local h0,oG2antt,var_Columns,var_Editor,var_Editor1,var_Items

oG2antt = form.EXG2ANTTCHARTACTIVEXCONTROL1.nativeObject
oG2antt.BeginUpdate()
var_Columns = oG2antt.Columns
	var_Editor = var_Columns.Add("A").Editor
		var_Editor.Appearance = 4
		var_Editor.EditType = 1
	var_Editor1 = var_Columns.Add("B").Editor
		var_Editor1.Appearance = 4
		var_Editor1.EditType = 1
var_Items = oG2antt.Items
	h0 = var_Items.AddItem("Item A.1")
	// var_Items.CellValue(h0,1) = "Item B.1"
	with (oG2antt)
		TemplateDef = [dim var_Items,h0]
		TemplateDef = var_Items
		TemplateDef = h0
		Template = [var_Items.CellValue(h0,1) = "Item B.1"]
	endwith
	h0 = var_Items.AddItem("Item A.2")
	// var_Items.CellValue(h0,1) = "Item B.2"
	with (oG2antt)
		TemplateDef = [dim var_Items,h0]
		TemplateDef = var_Items
		TemplateDef = h0
		Template = [var_Items.CellValue(h0,1) = "Item B.2"]
	endwith
oG2antt.EndUpdate()
|
|
2077
|
I am using AddNew to add new records, but I can not see them into the control
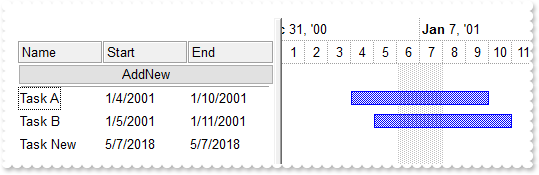
/*
with (this.EXG2ANTTCHARTACTIVEXCONTROL1.nativeObject)
	AddItem = class::nativeObject_AddItem
endwith
*/
// Occurs after a new Item has been inserted to Items collection.
function nativeObject_AddItem(Item)
	local var_Items
	oG2antt = form.EXG2ANTTCHARTACTIVEXCONTROL1.nativeObject
	var_Items = oG2antt.Items
		var_Items.AddBar(Item,"Task",var_Items.CellValue(Item,1),var_Items.CellValue(Item,2))
return

/*
with (this.EXG2ANTTCHARTACTIVEXCONTROL1.nativeObject)
	ButtonClick = class::nativeObject_ButtonClick
endwith
*/
// Occurs when user clicks on the cell's button.
function nativeObject_ButtonClick(Item, ColIndex, Key)
	local var_Recordset
	oG2antt = form.EXG2ANTTCHARTACTIVEXCONTROL1.nativeObject
	var_Recordset = oG2antt.DataSource
		var_Recordset.AddNew()
		var_Recordset.Fields.Item("Name").Value = "Task New"
		var_Recordset.Update()
return

local h,oG2antt,rs,var_Chart,var_Columns,var_Columns1,var_Fields,var_Items

oG2antt = form.EXG2ANTTCHARTACTIVEXCONTROL1.nativeObject
oG2antt.BeginUpdate()
oG2antt.HeaderAppearance = 4
rs = new OleAutoClient("ADODB.Recordset")
	var_Fields = rs.Fields
		var_Fields.Append("Name",8)
		var_Fields.Append("Start",7)
		var_Fields.Append("End",7)
	rs.Open()
	rs.AddNew()
	rs.Fields.Item("Name").Value = "Task A"
	rs.Fields.Item("Start").Value = "01/04/2001"
	rs.Fields.Item("End").Value = "01/10/2001"
	rs.Update()
	rs.AddNew()
	rs.Fields.Item("Name").Value = "Task B"
	rs.Fields.Item("Start").Value = "01/05/2001"
	rs.Fields.Item("End").Value = "01/11/2001"
	rs.Update()
oG2antt.DataSource = rs
var_Chart = oG2antt.Chart
	var_Chart.FirstVisibleDate = "01/01/2001"
	var_Chart.LevelCount = 2
	// var_Chart.PaneWidth(false) = 256
	with (oG2antt)
		TemplateDef = [dim var_Chart]
		TemplateDef = var_Chart
		Template = [var_Chart.PaneWidth(False) = 256]
	endwith
oG2antt.Items.AllowCellValueToItemBar = true
// oG2antt.Columns.Item("Start").Def(18) = 1
var_Columns = oG2antt.Columns.Item("Start")
with (oG2antt)
	TemplateDef = [dim var_Columns]
	TemplateDef = var_Columns
	Template = [var_Columns.Def(18) = 1]
endwith
// oG2antt.Columns.Item("End").Def(18) = 2
var_Columns1 = oG2antt.Columns.Item("End")
with (oG2antt)
	TemplateDef = [dim var_Columns1]
	TemplateDef = var_Columns1
	Template = [var_Columns1.Def(18) = 2]
endwith
var_Items = oG2antt.Items
	// var_Items.LockedItemCount(0) = 1
	with (oG2antt)
		TemplateDef = [dim var_Items]
		TemplateDef = var_Items
		Template = [var_Items.LockedItemCount(0) = 1]
	endwith
	h = var_Items.LockedItem(0,0)
	// var_Items.ItemDivider(h) = 0
	with (oG2antt)
		TemplateDef = [dim var_Items,h]
		TemplateDef = var_Items
		TemplateDef = h
		Template = [var_Items.ItemDivider(h) = 0]
	endwith
	// var_Items.CellHasButton(h,0) = true
	with (oG2antt)
		TemplateDef = [dim var_Items,h]
		TemplateDef = var_Items
		TemplateDef = h
		Template = [var_Items.CellHasButton(h,0) = True]
	endwith
	// var_Items.CellValue(h,0) = "AddNew"
	with (oG2antt)
		TemplateDef = [dim var_Items,h]
		TemplateDef = var_Items
		TemplateDef = h
		Template = [var_Items.CellValue(h,0) = "AddNew"]
	endwith
	// var_Items.CellHAlignment(h,0) = 1
	with (oG2antt)
		TemplateDef = [dim var_Items,h]
		TemplateDef = var_Items
		TemplateDef = h
		Template = [var_Items.CellHAlignment(h,0) = 1]
	endwith
oG2antt.DetectAddNew = true
oG2antt.DetectDelete = true
oG2antt.EndUpdate()
|
|
2076
|
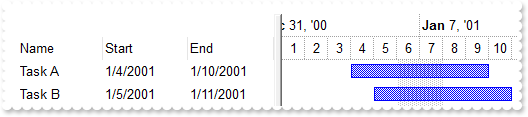
How can I create a new ADO recordset
/*
with (this.EXG2ANTTCHARTACTIVEXCONTROL1.nativeObject)
	AddItem = class::nativeObject_AddItem
endwith
*/
// Occurs after a new Item has been inserted to Items collection.
function nativeObject_AddItem(Item)
	local var_Items
	oG2antt = form.EXG2ANTTCHARTACTIVEXCONTROL1.nativeObject
	var_Items = oG2antt.Items
		var_Items.AddBar(Item,"Task",var_Items.CellValue(Item,1),var_Items.CellValue(Item,2))
return

local oG2antt,rs,var_Chart,var_Columns,var_Columns1,var_Fields

oG2antt = form.EXG2ANTTCHARTACTIVEXCONTROL1.nativeObject
oG2antt.BeginUpdate()
rs = new OleAutoClient("ADODB.Recordset")
	var_Fields = rs.Fields
		var_Fields.Append("Name",8)
		var_Fields.Append("Start",7)
		var_Fields.Append("End",7)
	rs.Open()
	rs.AddNew()
	rs.Fields = "Task A"
	rs.Fields = "01/04/2001"
	rs.Fields = "01/10/2001"
	rs.Update()
	rs.AddNew()
	rs.Fields = "Task B"
	rs.Fields = "01/05/2001"
	rs.Fields = "01/11/2001"
	rs.Update()
oG2antt.DataSource = rs
var_Chart = oG2antt.Chart
	var_Chart.FirstVisibleDate = "01/01/2001"
	var_Chart.LevelCount = 2
	// var_Chart.PaneWidth(false) = 256
	with (oG2antt)
		TemplateDef = [dim var_Chart]
		TemplateDef = var_Chart
		Template = [var_Chart.PaneWidth(False) = 256]
	endwith
oG2antt.Items.AllowCellValueToItemBar = true
// oG2antt.Columns.Item("Start").Def(18) = 1
var_Columns = oG2antt.Columns.Item("Start")
with (oG2antt)
	TemplateDef = [dim var_Columns]
	TemplateDef = var_Columns
	Template = [var_Columns.Def(18) = 1]
endwith
// oG2antt.Columns.Item("End").Def(18) = 2
var_Columns1 = oG2antt.Columns.Item("End")
with (oG2antt)
	TemplateDef = [dim var_Columns1]
	TemplateDef = var_Columns1
	Template = [var_Columns1.Def(18) = 2]
endwith
oG2antt.EndUpdate()
|
|
2075
|
Do do I get the DAO version I have installed

local oG2antt

oG2antt = form.EXG2ANTTCHARTACTIVEXCONTROL1.nativeObject
? new OleAutoClient("DAO.DBEngine.35").Version
? new OleAutoClient("DAO.DBEngine.36").Version
? new OleAutoClient("DAO.DBEngine.120").Version
|
|
2074
|
How do I get a list of interfaces the object implemenets
/*
with (this.EXG2ANTTCHARTACTIVEXCONTROL1.nativeObject)
AddItem = class::nativeObject_AddItem
endwith
*/
// Occurs after a new Item has been inserted to Items collection.
function nativeObject_AddItem(Item)
local var_Items
oG2antt = form.EXG2ANTTCHARTACTIVEXCONTROL1.nativeObject
var_Items = oG2antt.Items
var_Items.AddBar(Item,"Task",var_Items.CellValue(Item,2),var_Items.CellValue(Item,4))
return
local oG2antt,rs,var_Chart,var_Columns,var_Columns1,var_PrivDBEngine
oG2antt = form.EXG2ANTTCHARTACTIVEXCONTROL1.nativeObject
oG2antt.BeginUpdate()
oG2antt.ColumnAutoResize = false
var_PrivDBEngine = new OleAutoClient("DAO.DBEngine.120")
rs = var_PrivDBEngine.OpenDatabase("C:\Program Files\Exontrol\ExG2antt\Sample\Access\misc.accdb").OpenRecordset("Orders")
? Str(new OleAutoClient("Exontrol.PropertiesList"))
oG2antt.DataSource = rs
var_Chart = oG2antt.Chart
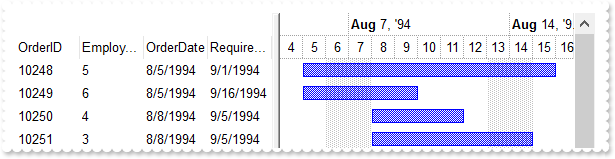
var_Chart.FirstVisibleDate = "08/04/1994"
var_Chart.LevelCount = 2
// var_Chart.PaneWidth(false) = 256
with (oG2antt)
TemplateDef = [dim var_Chart]
TemplateDef = var_Chart
Template = [var_Chart.PaneWidth(False) = 256]
endwith
oG2antt.Items.AllowCellValueToItemBar = true
// oG2antt.Columns.Item(2).Def(18) = 1
var_Columns = oG2antt.Columns.Item(2)
with (oG2antt)
TemplateDef = [dim var_Columns]
TemplateDef = var_Columns
Template = [var_Columns.Def(18) = 1]
endwith
// oG2antt.Columns.Item(4).Def(18) = 2
var_Columns1 = oG2antt.Columns.Item(4)
with (oG2antt)
TemplateDef = [dim var_Columns1]
TemplateDef = var_Columns1
Template = [var_Columns1.Def(18) = 2]
endwith
oG2antt.EndUpdate()
|
|
2073
|
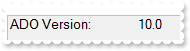
Do do I get the ADO version I have installed
local oG2antt

oG2antt = form.EXG2ANTTCHARTACTIVEXCONTROL1.nativeObject
? "ADO Version:"
? new OleAutoClient("ADODB.Connection").Version
|
|
2072
|
DAO, ACCDB, 120
/*
with (this.EXG2ANTTCHARTACTIVEXCONTROL1.nativeObject)
	AddItem = class::nativeObject_AddItem
endwith
*/
// Occurs after a new Item has been inserted to Items collection.
function nativeObject_AddItem(Item)
	local var_Items
	oG2antt = form.EXG2ANTTCHARTACTIVEXCONTROL1.nativeObject
	var_Items = oG2antt.Items
		var_Items.AddBar(Item,"Task",var_Items.CellValue(Item,2),var_Items.CellValue(Item,4))
return

local oG2antt,rs,var_Chart,var_Columns,var_Columns1,var_PrivDBEngine

oG2antt = form.EXG2ANTTCHARTACTIVEXCONTROL1.nativeObject
oG2antt.BeginUpdate()
oG2antt.ColumnAutoResize = false
var_PrivDBEngine = new OleAutoClient("DAO.DBEngine.120")
	rs = var_PrivDBEngine.OpenDatabase("C:\Program Files\Exontrol\ExG2antt\Sample\Access\misc.accdb").OpenRecordset("Orders")
oG2antt.DataSource = rs
var_Chart = oG2antt.Chart
	var_Chart.FirstVisibleDate = "08/04/1994"
	var_Chart.LevelCount = 2
	// var_Chart.PaneWidth(false) = 256
	with (oG2antt)
		TemplateDef = [dim var_Chart]
		TemplateDef = var_Chart
		Template = [var_Chart.PaneWidth(False) = 256]
	endwith
oG2antt.Items.AllowCellValueToItemBar = true
// oG2antt.Columns.Item(2).Def(18) = 1
var_Columns = oG2antt.Columns.Item(2)
with (oG2antt)
	TemplateDef = [dim var_Columns]
	TemplateDef = var_Columns
	Template = [var_Columns.Def(18) = 1]
endwith
// oG2antt.Columns.Item(4).Def(18) = 2
var_Columns1 = oG2antt.Columns.Item(4)
with (oG2antt)
	TemplateDef = [dim var_Columns1]
	TemplateDef = var_Columns1
	Template = [var_Columns1.Def(18) = 2]
endwith
oG2antt.EndUpdate()
|
|
2071
|
DAO, MDB, 120
/*
with (this.EXG2ANTTCHARTACTIVEXCONTROL1.nativeObject)
	AddItem = class::nativeObject_AddItem
endwith
*/
// Occurs after a new Item has been inserted to Items collection.
function nativeObject_AddItem(Item)
	local var_Items
	oG2antt = form.EXG2ANTTCHARTACTIVEXCONTROL1.nativeObject
	var_Items = oG2antt.Items
		var_Items.AddBar(Item,"Task",var_Items.CellValue(Item,2),var_Items.CellValue(Item,4))
return

local oG2antt,rs,var_Chart,var_Columns,var_Columns1,var_PrivDBEngine

oG2antt = form.EXG2ANTTCHARTACTIVEXCONTROL1.nativeObject
oG2antt.BeginUpdate()
oG2antt.ColumnAutoResize = false
var_PrivDBEngine = new OleAutoClient("DAO.DBEngine.120")
	rs = var_PrivDBEngine.OpenDatabase("C:\Program Files\Exontrol\ExG2antt\sample\Access\misc.mdb").OpenRecordset("Orders")
oG2antt.DataSource = rs
var_Chart = oG2antt.Chart
	var_Chart.FirstVisibleDate = "08/04/1994"
	var_Chart.LevelCount = 2
	// var_Chart.PaneWidth(false) = 256
	with (oG2antt)
		TemplateDef = [dim var_Chart]
		TemplateDef = var_Chart
		Template = [var_Chart.PaneWidth(False) = 256]
	endwith
oG2antt.Items.AllowCellValueToItemBar = true
// oG2antt.Columns.Item(2).Def(18) = 1
var_Columns = oG2antt.Columns.Item(2)
with (oG2antt)
	TemplateDef = [dim var_Columns]
	TemplateDef = var_Columns
	Template = [var_Columns.Def(18) = 1]
endwith
// oG2antt.Columns.Item(4).Def(18) = 2
var_Columns1 = oG2antt.Columns.Item(4)
with (oG2antt)
	TemplateDef = [dim var_Columns1]
	TemplateDef = var_Columns1
	Template = [var_Columns1.Def(18) = 2]
endwith
oG2antt.EndUpdate()
|
|
2070
|
DAO, MDB
/*
with (this.EXG2ANTTCHARTACTIVEXCONTROL1.nativeObject)
	AddItem = class::nativeObject_AddItem
endwith
*/
// Occurs after a new Item has been inserted to Items collection.
function nativeObject_AddItem(Item)
	local var_Items
	oG2antt = form.EXG2ANTTCHARTACTIVEXCONTROL1.nativeObject
	var_Items = oG2antt.Items
		var_Items.AddBar(Item,"Task",var_Items.CellValue(Item,2),var_Items.CellValue(Item,4))
return

local oG2antt,rs,var_Chart,var_Columns,var_Columns1,var_PrivDBEngine

oG2antt = form.EXG2ANTTCHARTACTIVEXCONTROL1.nativeObject
oG2antt.BeginUpdate()
oG2antt.ColumnAutoResize = false
var_PrivDBEngine = new OleAutoClient("DAO.DBEngine.36")
	rs = var_PrivDBEngine.OpenDatabase("C:\Program Files\Exontrol\ExG2antt\sample\Access\misc.mdb").OpenRecordset("Orders")
oG2antt.DataSource = rs
var_Chart = oG2antt.Chart
	var_Chart.FirstVisibleDate = "08/04/1994"
	var_Chart.LevelCount = 2
	// var_Chart.PaneWidth(false) = 256
	with (oG2antt)
		TemplateDef = [dim var_Chart]
		TemplateDef = var_Chart
		Template = [var_Chart.PaneWidth(False) = 256]
	endwith
oG2antt.Items.AllowCellValueToItemBar = true
// oG2antt.Columns.Item(2).Def(18) = 1
var_Columns = oG2antt.Columns.Item(2)
with (oG2antt)
	TemplateDef = [dim var_Columns]
	TemplateDef = var_Columns
	Template = [var_Columns.Def(18) = 1]
endwith
// oG2antt.Columns.Item(4).Def(18) = 2
var_Columns1 = oG2antt.Columns.Item(4)
with (oG2antt)
	TemplateDef = [dim var_Columns1]
	TemplateDef = var_Columns1
	Template = [var_Columns1.Def(18) = 2]
endwith
oG2antt.EndUpdate()
|
|
2069
|
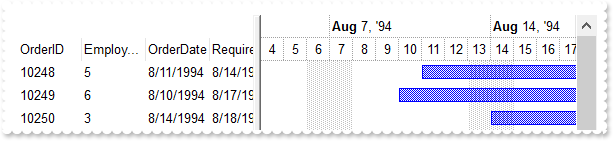
ADODB, ACCDB, x64
/*
with (this.EXG2ANTTCHARTACTIVEXCONTROL1.nativeObject)
	AddItem = class::nativeObject_AddItem
endwith
*/
// Occurs after a new Item has been inserted to Items collection.
function nativeObject_AddItem(Item)
	local var_Items
	oG2antt = form.EXG2ANTTCHARTACTIVEXCONTROL1.nativeObject
	var_Items = oG2antt.Items
		var_Items.AddBar(Item,"Task",var_Items.CellValue(Item,2),var_Items.CellValue(Item,4))
return

local oG2antt,rs,var_Chart,var_Columns,var_Columns1

oG2antt = form.EXG2ANTTCHARTACTIVEXCONTROL1.nativeObject
oG2antt.BeginUpdate()
oG2antt.ColumnAutoResize = false
rs = new OleAutoClient("ADODB.Recordset")
	rs.Open("Orders","Provider=Microsoft.ACE.OLEDB.12.0;Data Source=C:\Program Files\Exontrol\ExG2antt\Sample\Access\misc.accdb",1,1)
oG2antt.DataSource = rs
var_Chart = oG2antt.Chart
	var_Chart.FirstVisibleDate = "08/04/1994"
	var_Chart.LevelCount = 2
	// var_Chart.PaneWidth(false) = 256
	with (oG2antt)
		TemplateDef = [dim var_Chart]
		TemplateDef = var_Chart
		Template = [var_Chart.PaneWidth(False) = 256]
	endwith
oG2antt.Items.AllowCellValueToItemBar = true
// oG2antt.Columns.Item(2).Def(18) = 1
var_Columns = oG2antt.Columns.Item(2)
with (oG2antt)
	TemplateDef = [dim var_Columns]
	TemplateDef = var_Columns
	Template = [var_Columns.Def(18) = 1]
endwith
// oG2antt.Columns.Item(4).Def(18) = 2
var_Columns1 = oG2antt.Columns.Item(4)
with (oG2antt)
	TemplateDef = [dim var_Columns1]
	TemplateDef = var_Columns1
	Template = [var_Columns1.Def(18) = 2]
endwith
oG2antt.EndUpdate()
|
|
2068
|
ADOR, ACCDB
/*
with (this.EXG2ANTTCHARTACTIVEXCONTROL1.nativeObject)
	AddItem = class::nativeObject_AddItem
endwith
*/
// Occurs after a new Item has been inserted to Items collection.
function nativeObject_AddItem(Item)
	local var_Items
	oG2antt = form.EXG2ANTTCHARTACTIVEXCONTROL1.nativeObject
	var_Items = oG2antt.Items
		var_Items.AddBar(Item,"Task",var_Items.CellValue(Item,2),var_Items.CellValue(Item,4))
return

local oG2antt,rs,var_Chart,var_Columns,var_Columns1

oG2antt = form.EXG2ANTTCHARTACTIVEXCONTROL1.nativeObject
oG2antt.BeginUpdate()
oG2antt.ColumnAutoResize = false
rs = new OleAutoClient("ADOR.Recordset")
	rs.Open("Orders","Provider=Microsoft.ACE.OLEDB.12.0;Data Source=C:\Program Files\Exontrol\ExG2antt\Sample\Access\misc.accdb",3,3)
oG2antt.DataSource = rs
var_Chart = oG2antt.Chart
	var_Chart.FirstVisibleDate = "08/04/1994"
	var_Chart.LevelCount = 2
	// var_Chart.PaneWidth(false) = 256
	with (oG2antt)
		TemplateDef = [dim var_Chart]
		TemplateDef = var_Chart
		Template = [var_Chart.PaneWidth(False) = 256]
	endwith
oG2antt.Items.AllowCellValueToItemBar = true
// oG2antt.Columns.Item(2).Def(18) = 1
var_Columns = oG2antt.Columns.Item(2)
with (oG2antt)
	TemplateDef = [dim var_Columns]
	TemplateDef = var_Columns
	Template = [var_Columns.Def(18) = 1]
endwith
// oG2antt.Columns.Item(4).Def(18) = 2
var_Columns1 = oG2antt.Columns.Item(4)
with (oG2antt)
	TemplateDef = [dim var_Columns1]
	TemplateDef = var_Columns1
	Template = [var_Columns1.Def(18) = 2]
endwith
oG2antt.EndUpdate()
|
|
2067
|
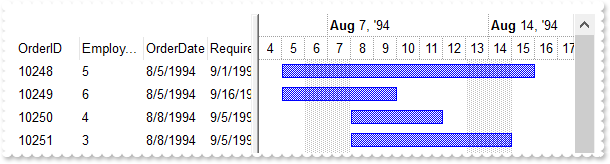
ADODB, MDB
/*
with (this.EXG2ANTTCHARTACTIVEXCONTROL1.nativeObject)
	AddItem = class::nativeObject_AddItem
endwith
*/
// Occurs after a new Item has been inserted to Items collection.
function nativeObject_AddItem(Item)
	local var_Items
	oG2antt = form.EXG2ANTTCHARTACTIVEXCONTROL1.nativeObject
	var_Items = oG2antt.Items
		var_Items.AddBar(Item,"Task",var_Items.CellValue(Item,2),var_Items.CellValue(Item,4))
return

local oG2antt,rs,var_Chart,var_Columns,var_Columns1

oG2antt = form.EXG2ANTTCHARTACTIVEXCONTROL1.nativeObject
oG2antt.BeginUpdate()
oG2antt.ColumnAutoResize = false
rs = new OleAutoClient("ADODB.Recordset")
	rs.Open("Orders","Provider=Microsoft.ACE.OLEDB.12.0;Data Source=C:\Program Files\Exontrol\ExG2antt\Sample\Access\misc.accdb",3,3)
oG2antt.DataSource = rs
var_Chart = oG2antt.Chart
	var_Chart.FirstVisibleDate = "08/04/1994"
	var_Chart.LevelCount = 2
	// var_Chart.PaneWidth(false) = 256
	with (oG2antt)
		TemplateDef = [dim var_Chart]
		TemplateDef = var_Chart
		Template = [var_Chart.PaneWidth(False) = 256]
	endwith
oG2antt.Items.AllowCellValueToItemBar = true
// oG2antt.Columns.Item(2).Def(18) = 1
var_Columns = oG2antt.Columns.Item(2)
with (oG2antt)
	TemplateDef = [dim var_Columns]
	TemplateDef = var_Columns
	Template = [var_Columns.Def(18) = 1]
endwith
// oG2antt.Columns.Item(4).Def(18) = 2
var_Columns1 = oG2antt.Columns.Item(4)
with (oG2antt)
	TemplateDef = [dim var_Columns1]
	TemplateDef = var_Columns1
	Template = [var_Columns1.Def(18) = 2]
endwith
oG2antt.EndUpdate()
|
|
2066
|
ADOR, MDB
/*
with (this.EXG2ANTTCHARTACTIVEXCONTROL1.nativeObject)
	AddItem = class::nativeObject_AddItem
endwith
*/
// Occurs after a new Item has been inserted to Items collection.
function nativeObject_AddItem(Item)
	local var_Items
	oG2antt = form.EXG2ANTTCHARTACTIVEXCONTROL1.nativeObject
	var_Items = oG2antt.Items
		var_Items.AddBar(Item,"Task",var_Items.CellValue(Item,2),var_Items.CellValue(Item,4))
return

local oG2antt,rs,var_Chart,var_Columns,var_Columns1

oG2antt = form.EXG2ANTTCHARTACTIVEXCONTROL1.nativeObject
oG2antt.BeginUpdate()
oG2antt.ColumnAutoResize = false
rs = new OleAutoClient("ADOR.Recordset")
	rs.Open("Orders","Provider=Microsoft.ACE.OLEDB.12.0;Data Source=C:\Program Files\Exontrol\ExG2antt\Sample\Access\misc.accdb",3,3)
oG2antt.DataSource = rs
var_Chart = oG2antt.Chart
	var_Chart.FirstVisibleDate = "08/04/1994"
	var_Chart.LevelCount = 2
	// var_Chart.PaneWidth(false) = 256
	with (oG2antt)
		TemplateDef = [dim var_Chart]
		TemplateDef = var_Chart
		Template = [var_Chart.PaneWidth(False) = 256]
	endwith
oG2antt.Items.AllowCellValueToItemBar = true
// oG2antt.Columns.Item(2).Def(18) = 1
var_Columns = oG2antt.Columns.Item(2)
with (oG2antt)
	TemplateDef = [dim var_Columns]
	TemplateDef = var_Columns
	Template = [var_Columns.Def(18) = 1]
endwith
// oG2antt.Columns.Item(4).Def(18) = 2
var_Columns1 = oG2antt.Columns.Item(4)
with (oG2antt)
	TemplateDef = [dim var_Columns1]
	TemplateDef = var_Columns1
	Template = [var_Columns1.Def(18) = 2]
endwith
oG2antt.EndUpdate()
|
|
2065
|
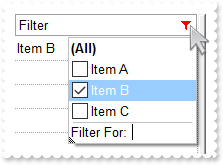
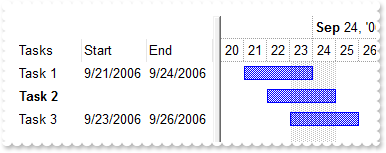
I am using exCellValueToItemBarProperty, Is it possible to �disable� this synchronisation for one (or several) item (sample-2)
local h,oG2antt,var_Chart,var_Column,var_Column1,var_Columns,var_Items

oG2antt = form.EXG2ANTTCHARTACTIVEXCONTROL1.nativeObject
oG2antt.BeginUpdate()
var_Columns = oG2antt.Columns
	var_Columns.Add("Tasks")
	// var_Columns.Add("Start").Def(18) = 1
	var_Column = var_Columns.Add("Start")
	with (oG2antt)
		TemplateDef = [dim var_Column]
		TemplateDef = var_Column
		Template = [var_Column.Def(18) = 1]
	endwith
	// var_Columns.Add("End").Def(18) = 2
	var_Column1 = var_Columns.Add("End")
	with (oG2antt)
		TemplateDef = [dim var_Column1]
		TemplateDef = var_Column1
		Template = [var_Column1.Def(18) = 2]
	endwith
var_Chart = oG2antt.Chart
	var_Chart.FirstVisibleDate = "09/20/2006"
	var_Chart.LevelCount = 2
	// var_Chart.PaneWidth(false) = 196
	with (oG2antt)
		TemplateDef = [dim var_Chart]
		TemplateDef = var_Chart
		Template = [var_Chart.PaneWidth(0) = 196]
	endwith
	var_Chart.AllowCreateBar = 1
var_Items = oG2antt.Items
	var_Items.AllowCellValueToItemBar = true
	var_Items.AddBar(var_Items.AddItem("Task 1"),"Task","09/21/2006","09/24/2006")
	h = var_Items.AddItem("Task 2")
	var_Items.AddBar(h,"Task","09/22/2006","09/25/2006")
	// var_Items.ItemBold(h) = true
	with (oG2antt)
		TemplateDef = [dim var_Items,h]
		TemplateDef = var_Items
		TemplateDef = h
		Template = [var_Items.ItemBold(h) = True]
	endwith
	var_Items.CellValueToItemBar(h,1,1,"newbar")
	var_Items.CellValueToItemBar(h,2,2,"newbar")
	var_Items.AddBar(var_Items.AddItem("Task 3"),"Task","09/23/2006","09/26/2006")
oG2antt.EndUpdate()
|
|
2064
|
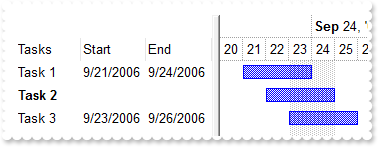
I am using exCellValueToItemBarProperty, Is it possible to �disable� this synchronisation for one (or several) item (sample-1)
local h,oG2antt,var_Chart,var_Column,var_Column1,var_Columns,var_Items

oG2antt = form.EXG2ANTTCHARTACTIVEXCONTROL1.nativeObject
oG2antt.BeginUpdate()
var_Columns = oG2antt.Columns
	var_Columns.Add("Tasks")
	// var_Columns.Add("Start").Def(18) = 1
	var_Column = var_Columns.Add("Start")
	with (oG2antt)
		TemplateDef = [dim var_Column]
		TemplateDef = var_Column
		Template = [var_Column.Def(18) = 1]
	endwith
	// var_Columns.Add("End").Def(18) = 2
	var_Column1 = var_Columns.Add("End")
	with (oG2antt)
		TemplateDef = [dim var_Column1]
		TemplateDef = var_Column1
		Template = [var_Column1.Def(18) = 2]
	endwith
var_Chart = oG2antt.Chart
	var_Chart.FirstVisibleDate = "09/20/2006"
	var_Chart.LevelCount = 2
	// var_Chart.PaneWidth(false) = 196
	with (oG2antt)
		TemplateDef = [dim var_Chart]
		TemplateDef = var_Chart
		Template = [var_Chart.PaneWidth(0) = 196]
	endwith
var_Items = oG2antt.Items
	var_Items.AllowCellValueToItemBar = true
	var_Items.AddBar(var_Items.AddItem("Task 1"),"Task","09/21/2006","09/24/2006")
	h = var_Items.AddItem("Task 2")
	var_Items.AddBar(h,"Task","09/22/2006","09/25/2006")
	// var_Items.FormatCell(h,1) = "``"
	with (oG2antt)
		TemplateDef = [dim var_Items,h]
		TemplateDef = var_Items
		TemplateDef = h
		Template = [var_Items.FormatCell(h,1) = "``"]
	endwith
	// var_Items.FormatCell(h,2) = "``"
	with (oG2antt)
		TemplateDef = [dim var_Items,h]
		TemplateDef = var_Items
		TemplateDef = h
		Template = [var_Items.FormatCell(h,2) = "``"]
	endwith
	// var_Items.ItemBold(h) = true
	with (oG2antt)
		TemplateDef = [dim var_Items,h]
		TemplateDef = var_Items
		TemplateDef = h
		Template = [var_Items.ItemBold(h) = True]
	endwith
	var_Items.AddBar(var_Items.AddItem("Task 3"),"Task","09/23/2006","09/26/2006")
oG2antt.EndUpdate()
|
|
2063
|
How can I use the CRD (eXCRD format)
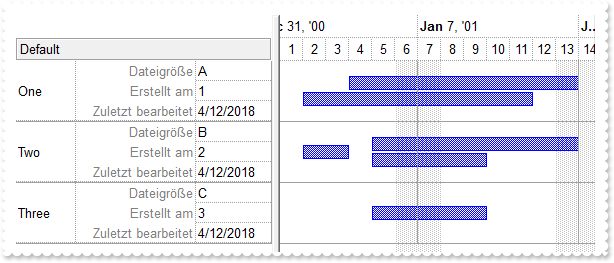
local dih,h,oG2antt,var_Chart,var_Column,var_Column1,var_Column2,var_Column3,var_Column4,var_Items
oG2antt = form.EXG2ANTTCHARTACTIVEXCONTROL1.nativeObject
oG2antt.BeginUpdate()
oG2antt.HeaderAppearance = 4
oG2antt.SelBackMode = 1
var_Column = oG2antt.Columns.Add("Default")
// var_Column.Def(32) = "[b=0]60;1[b=15]:60,((20;" + ["] + "<fgcolor=808080>Dateigr��e" + ["] + "[b=1][a=2]:120,2[b=15])/(20;" + ["] + "<fgcolor=808080>Erstellt am" + ["] + "[a=2]:120,3[b=15])/(20;" + ["] + "<fgcolor=808080>Zuletzt bearbeitet" + ["] + "[b=4][a=2]:120,4[b=15]))"
with (oG2antt)
TemplateDef = [dim var_Column]
TemplateDef = var_Column
Template = [var_Column.Def(32) = "[b=0]60;1[b=15]:60,((20;""<fgcolor=808080>Dateigr��e""[b=1][a=2]:120,2[b=15])/(20;""<fgcolor=808080>Erstellt am""[a=2]:120,3[b=15])/(20;""<fgcolor=808080>Zuletzt bearbeitet""[b=4][a=2]:120,4[b=15]))"]
endwith
var_Column.AllowSort = false
// oG2antt.Columns.Add(Str(1)).Visible = false
var_Column1 = oG2antt.Columns.Add(Str(1))
with (oG2antt)
TemplateDef = [dim var_Column1]
TemplateDef = var_Column1
Template = [var_Column1.Visible = False]
endwith
var_Column2 = oG2antt.Columns.Add(Str(2))
var_Column2.Visible = false
var_Column2.Editor.EditType = 1
var_Column2.FormatColumn = "1 index `A-Z`"
var_Column3 = oG2antt.Columns.Add(Str(3))
var_Column3.Visible = false
var_Column3.Editor.EditType = 1
var_Column3.FormatColumn = "1 index ``"
var_Column4 = oG2antt.Columns.Add(Str(4))
var_Column4.Visible = false
var_Column4.Editor.EditType = 1
var_Column4.FormatColumn = "date(``)"
dih = 48
oG2antt.DefaultItemHeight = dih
oG2antt.DrawGridLines = -2
oG2antt.GridLineStyle = 48
var_Chart = oG2antt.Chart
var_Chart.DrawGridLines = -2
var_Chart.GridLineStyle = 48
// var_Chart.PaneWidth(false) = 256
with (oG2antt)
TemplateDef = [dim var_Chart]
TemplateDef = var_Chart
Template = [var_Chart.PaneWidth(False) = 256]
endwith
var_Chart.LevelCount = 2
var_Chart.FirstVisibleDate = "01/01/2001"
var_Chart.Bars.Item("Task").OverlaidType = 515 /*exOverlaidBarsStackAutoArrange | exOverlaidBarsStack*/
var_Items = oG2antt.Items
h = var_Items.AddItem("")
// var_Items.CellValue(h,1) = "One"
with (oG2antt)
TemplateDef = [dim var_Items,h]
TemplateDef = var_Items
TemplateDef = h
Template = [var_Items.CellValue(h,1) = "One"]
endwith
var_Items.AddBar(h,"Task","01/02/2001","01/12/2001","A")
var_Items.AddBar(h,"Task","01/04/2001","01/14/2001","B")
// var_Items.ItemMaxHeight(h) = dih
with (oG2antt)
TemplateDef = [dim var_Items,h]
TemplateDef = var_Items
TemplateDef = h
Template = [var_Items.ItemMaxHeight(h) = dih]
endwith
h = var_Items.AddItem("")
// var_Items.CellValue(h,1) = "Two"
with (oG2antt)
TemplateDef = [dim var_Items,h]
TemplateDef = var_Items
TemplateDef = h
Template = [var_Items.CellValue(h,1) = "Two"]
endwith
var_Items.AddBar(h,"Task","01/05/2001","01/10/2001","A")
var_Items.AddBar(h,"Task","01/02/2001","01/04/2001","B")
var_Items.AddBar(h,"Task","01/05/2001","01/14/2001","B2")
// var_Items.ItemMaxHeight(h) = dih
with (oG2antt)
TemplateDef = [dim var_Items,h]
TemplateDef = var_Items
TemplateDef = h
Template = [var_Items.ItemMaxHeight(h) = dih]
endwith
h = var_Items.AddItem("")
// var_Items.CellValue(h,1) = "Three"
with (oG2antt)
TemplateDef = [dim var_Items,h]
TemplateDef = var_Items
TemplateDef = h
Template = [var_Items.CellValue(h,1) = "Three"]
endwith
var_Items.AddBar(h,"Task","01/05/2001","01/10/2001","A")
oG2antt.EndUpdate()
|
|
2062
|
Type of wraps the cell's caption support (Sample 2)
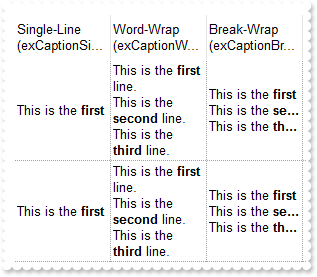
local oG2antt,var_Column,var_Column1,var_Column2,var_Columns,var_Items

oG2antt = form.EXG2ANTTCHARTACTIVEXCONTROL1.nativeObject
oG2antt.BeginUpdate()
oG2antt.HeaderSingleLine = false
oG2antt.HeaderHeight = 36
oG2antt.DrawGridLines = -2
oG2antt.ColumnAutoResize = false
oG2antt.ScrollBySingleLine = true
var_Columns = oG2antt.Columns
	var_Column = var_Columns.Add("Single-Line (exCaptionSingleLine)")
		var_Column.Width = 96
		// var_Column.Def(17) = 1
		with (oG2antt)
			TemplateDef = [dim var_Column]
			TemplateDef = var_Column
			Template = [var_Column.Def(17) = 1]
		endwith
		// var_Column.Def(16) = -1
		with (oG2antt)
			TemplateDef = [dim var_Column]
			TemplateDef = var_Column
			Template = [var_Column.Def(16) = -1]
		endwith
		// var_Column.Def(6) = 0
		with (oG2antt)
			TemplateDef = [dim var_Column]
			TemplateDef = var_Column
			Template = [var_Column.Def(6) = 0]
		endwith
	var_Column1 = var_Columns.Add("Word-Wrap (exCaptionWordWrap)")
		var_Column1.Width = 96
		// var_Column1.Def(17) = 1
		with (oG2antt)
			TemplateDef = [dim var_Column1]
			TemplateDef = var_Column1
			Template = [var_Column1.Def(17) = 1]
		endwith
		// var_Column1.Def(16) = 0
		with (oG2antt)
			TemplateDef = [dim var_Column1]
			TemplateDef = var_Column1
			Template = [var_Column1.Def(16) = 0]
		endwith
		// var_Column1.Def(6) = 0
		with (oG2antt)
			TemplateDef = [dim var_Column1]
			TemplateDef = var_Column1
			Template = [var_Column1.Def(6) = 0]
		endwith
		var_Column1.FormatColumn = "%0"
	var_Column2 = var_Columns.Add("Break-Wrap (exCaptionBreakWrap)")
		var_Column2.Width = 96
		// var_Column2.Def(17) = 1
		with (oG2antt)
			TemplateDef = [dim var_Column2]
			TemplateDef = var_Column2
			Template = [var_Column2.Def(17) = 1]
		endwith
		// var_Column2.Def(16) = 1
		with (oG2antt)
			TemplateDef = [dim var_Column2]
			TemplateDef = var_Column2
			Template = [var_Column2.Def(16) = 1]
		endwith
		// var_Column2.Def(6) = 0
		with (oG2antt)
			TemplateDef = [dim var_Column2]
			TemplateDef = var_Column2
			Template = [var_Column2.Def(6) = 0]
		endwith
		var_Column2.FormatColumn = "%0"
var_Items = oG2antt.Items
	var_Items.AddItem("This is the <b>first</b> line.<br>This is the <b>second</b> line.<br>This is the <b>third</b> line.")
	var_Items.AddItem("This is the <b>first</b> line.\r\nThis is the <b>second</b> line.\r\nThis is the <b>third</b> line.")
oG2antt.EndUpdate()
|
|
2061
|
Type of wraps the cell's caption support (Sample 1)
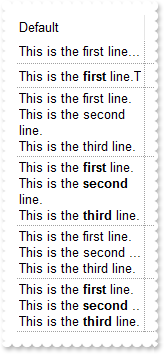
local h,oG2antt,var_Column,var_Items

oG2antt = form.EXG2ANTTCHARTACTIVEXCONTROL1.nativeObject
oG2antt.BeginUpdate()
oG2antt.HeaderSingleLine = false
oG2antt.HeaderHeight = 36
oG2antt.DrawGridLines = -2
oG2antt.ColumnAutoResize = false
oG2antt.ScrollBySingleLine = true
// oG2antt.Columns.Add("Default").Width = 128
var_Column = oG2antt.Columns.Add("Default")
with (oG2antt)
	TemplateDef = [dim var_Column]
	TemplateDef = var_Column
	Template = [var_Column.Width = 128]
endwith
var_Items = oG2antt.Items
	h = var_Items.AddItem("This is the first line.\r\nThis is the second line.\r\nThis is the third line.")
	h = var_Items.AddItem("This is the <b>first</b> line.<br>This is the <b>second</b> line.<br>This is the <b>third</b> line.")
	// var_Items.CellValueFormat(h,0) = 1
	with (oG2antt)
		TemplateDef = [dim var_Items,h]
		TemplateDef = var_Items
		TemplateDef = h
		Template = [var_Items.CellValueFormat(h,0) = 1]
	endwith
	h = var_Items.AddItem("This is the first line.\r\nThis is the second line.\r\nThis is the third line.")
	// var_Items.CellSingleLine(h,0) = 0
	with (oG2antt)
		TemplateDef = [dim var_Items,h]
		TemplateDef = var_Items
		TemplateDef = h
		Template = [var_Items.CellSingleLine(h,0) = 0]
	endwith
	h = var_Items.AddItem("This is the <b>first</b> line.<br>This is the <b>second</b> line.<br>This is the <b>third</b> line.")
	// var_Items.CellValueFormat(h,0) = 1
	with (oG2antt)
		TemplateDef = [dim var_Items,h]
		TemplateDef = var_Items
		TemplateDef = h
		Template = [var_Items.CellValueFormat(h,0) = 1]
	endwith
	// var_Items.CellSingleLine(h,0) = 0
	with (oG2antt)
		TemplateDef = [dim var_Items,h]
		TemplateDef = var_Items
		TemplateDef = h
		Template = [var_Items.CellSingleLine(h,0) = 0]
	endwith
	h = var_Items.AddItem("This is the first line.\r\nThis is the second line.\r\nThis is the third line.")
	// var_Items.CellSingleLine(h,0) = 1
	with (oG2antt)
		TemplateDef = [dim var_Items,h]
		TemplateDef = var_Items
		TemplateDef = h
		Template = [var_Items.CellSingleLine(h,0) = 1]
	endwith
	h = var_Items.AddItem("This is the <b>first</b> line.<br>This is the <b>second</b> line.<br>This is the <b>third</b> line.")
	// var_Items.CellValueFormat(h,0) = 1
	with (oG2antt)
		TemplateDef = [dim var_Items,h]
		TemplateDef = var_Items
		TemplateDef = h
		Template = [var_Items.CellValueFormat(h,0) = 1]
	endwith
	// var_Items.CellSingleLine(h,0) = 1
	with (oG2antt)
		TemplateDef = [dim var_Items,h]
		TemplateDef = var_Items
		TemplateDef = h
		Template = [var_Items.CellSingleLine(h,0) = 1]
	endwith
oG2antt.EndUpdate()
|
|
2060
|
Can I break the cell's caption using the line break <br> or \r\n (Sample 2)
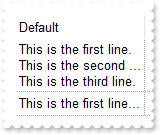
local oG2antt,var_Column,var_Items

oG2antt = form.EXG2ANTTCHARTACTIVEXCONTROL1.nativeObject
oG2antt.BeginUpdate()
oG2antt.DrawGridLines = -2
oG2antt.ColumnAutoResize = false
oG2antt.ScrollBySingleLine = true
// oG2antt.Columns.Add("Default").Width = 128
var_Column = oG2antt.Columns.Add("Default")
with (oG2antt)
	TemplateDef = [dim var_Column]
	TemplateDef = var_Column
	Template = [var_Column.Width = 128]
endwith
var_Items = oG2antt.Items
	// var_Items.CellSingleLine(var_Items.AddItem("This is the first line.\r\nThis is the second line.\r\nThis is the third line."),0) = 1
	with (oG2antt)
		TemplateDef = [dim var_Items]
		TemplateDef = var_Items
		Template = [var_Items.CellSingleLine(AddItem("This is the first line.\r\nThis is the second line.\r\nThis is the third line."),0) = 1]
	endwith
	var_Items.AddItem("This is the first line.\r\nThis is the second line.\r\nThis is the third line.")
oG2antt.EndUpdate()
|
|
2059
|
Can I break the cell's caption using the line break <br> or \r\n (Sample 1)
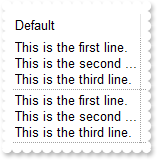
local oG2antt,var_Column,var_Items

oG2antt = form.EXG2ANTTCHARTACTIVEXCONTROL1.nativeObject
oG2antt.BeginUpdate()
oG2antt.DrawGridLines = -2
oG2antt.ColumnAutoResize = false
oG2antt.ScrollBySingleLine = true
var_Column = oG2antt.Columns.Add("Default")
	var_Column.Width = 128
	// var_Column.Def(16) = 1
	with (oG2antt)
		TemplateDef = [dim var_Column]
		TemplateDef = var_Column
		Template = [var_Column.Def(16) = 1]
	endwith
var_Items = oG2antt.Items
	var_Items.AddItem("This is the first line.\r\nThis is the second line.\r\nThis is the third line.")
	var_Items.AddItem("This is the first line.\r\nThis is the second line.\r\nThis is the third line.")
oG2antt.EndUpdate()
|
|
2058
|
The histogram is showing empty space, when expanding an item. What could be wrong
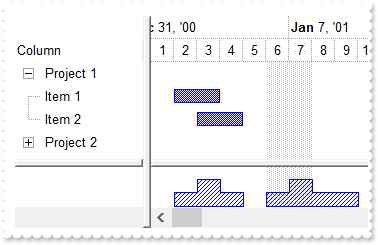
local h,oG2antt,var_Chart,var_Items

oG2antt = form.EXG2ANTTCHARTACTIVEXCONTROL1.nativeObject
oG2antt.BeginUpdate()
oG2antt.LinesAtRoot = 5
var_Chart = oG2antt.Chart
	var_Chart.LevelCount = 2
	// var_Chart.PaneWidth(false) = 128
	with (oG2antt)
		TemplateDef = [dim var_Chart]
		TemplateDef = var_Chart
		Template = [var_Chart.PaneWidth(False) = 128]
	endwith
	var_Chart.FirstVisibleDate = "01/01/2001"
	var_Chart.HistogramVisible = true
	var_Chart.HistogramHeight = 48
	var_Chart.HistogramView = 1392 /*exHistogramNoGrouping | exHistogramLeafItems | exHistogramAllItems*/
	var_Chart.Bars.Item("Task").HistogramPattern = 6
oG2antt.Columns.Add("Column")
var_Items = oG2antt.Items
	h = var_Items.AddItem("Project 1")
	var_Items.AddBar(var_Items.InsertItem(h,null,"Item 1"),"Task","01/02/2001","01/04/2001")
	var_Items.AddBar(var_Items.InsertItem(h,null,"Item 2"),"Task","01/03/2001","01/05/2001")
	// var_Items.ExpandItem(h) = true
	with (oG2antt)
		TemplateDef = [dim var_Items,h]
		TemplateDef = var_Items
		TemplateDef = h
		Template = [var_Items.ExpandItem(h) = True]
	endwith
	h = var_Items.AddItem("Project 2")
	var_Items.AddBar(var_Items.InsertItem(h,null,"Item 1"),"Task","01/07/2001","01/10/2001")
	var_Items.AddBar(var_Items.InsertItem(h,null,"Item 2"),"Task","01/06/2001","01/08/2001")
oG2antt.EndUpdate()
|
|
2057
|
How can I change the visual appearance/color of the Filter For ... field
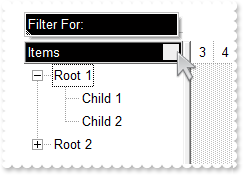
local h,oG2antt,var_Column,var_Items

oG2antt = form.EXG2ANTTCHARTACTIVEXCONTROL1.nativeObject
oG2antt.BeginUpdate()
oG2antt.LinesAtRoot = -1
oG2antt.BackColorHeader = 0x1
oG2antt.ForeColorHeader = 0xffffff
oG2antt.Template = [Background(26) = BackColorHeader] // oG2antt.Background(26) = oG2antt.BackColorHeader
oG2antt.Template = [Background(27) = ForeColorHeader] // oG2antt.Background(27) = oG2antt.ForeColorHeader
oG2antt.Template = [Background(0) = 15790320] // oG2antt.Background(0) = 0xf0f0f0
oG2antt.Template = [Background(32) = -1] // oG2antt.Background(32) = -1
oG2antt.HeaderAppearance = 5
var_Column = oG2antt.Columns.Add("Items")
	var_Column.FilterOnType = true
	var_Column.DisplayFilterButton = true
	var_Column.FilterList = 2
var_Items = oG2antt.Items
	h = var_Items.AddItem("Root 1")
	var_Items.InsertItem(h,null,"Child 1")
	var_Items.InsertItem(h,null,"Child 2")
	// var_Items.ExpandItem(h) = true
	with (oG2antt)
		TemplateDef = [dim var_Items,h]
		TemplateDef = var_Items
		TemplateDef = h
		Template = [var_Items.ExpandItem(h) = True]
	endwith
	h = var_Items.AddItem("Root 2")
	var_Items.InsertItem(h,null,"Child 1")
	var_Items.InsertItem(h,null,"Child 2")
oG2antt.EndUpdate()
|
|
2056
|
How can I display the cell's caption without spaces on both sides
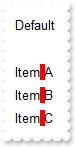
local oG2antt,var_Column,var_Items

oG2antt = form.EXG2ANTTCHARTACTIVEXCONTROL1.nativeObject
oG2antt.BeginUpdate()
oG2antt.ColumnAutoResize = true
var_Column = oG2antt.Columns.Add("Default")
	// var_Column.Def(17) = 1
	with (oG2antt)
		TemplateDef = [dim var_Column]
		TemplateDef = var_Column
		Template = [var_Column.Def(17) = 1]
	endwith
	var_Column.FormatColumn = "((trim(value) replace `   ` with ` `) replace `  ` with ` `) replace ` ` with `<bgcolor=FF0000> </bgcolor>`"
var_Items = oG2antt.Items
	var_Items.AddItem("")
	var_Items.AddItem("Item A")
	var_Items.AddItem("    Item B")
	var_Items.AddItem("        Item   C    ")
oG2antt.EndUpdate()
|
|
2055
|
How can I highlight the spaces within the column (sample 2)
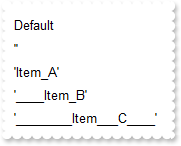
local oG2antt,var_Column,var_Items

oG2antt = form.EXG2ANTTCHARTACTIVEXCONTROL1.nativeObject
oG2antt.BeginUpdate()
oG2antt.ColumnAutoResize = true
var_Column = oG2antt.Columns.Add("Default")
	// var_Column.Def(17) = 1
	with (oG2antt)
		TemplateDef = [dim var_Column]
		TemplateDef = var_Column
		Template = [var_Column.Def(17) = 1]
	endwith
	var_Column.FormatColumn = "`'` + ( value replace ` ` with `_` ) + `'`"
var_Items = oG2antt.Items
	var_Items.AddItem("")
	var_Items.AddItem("Item A")
	var_Items.AddItem("    Item B")
	var_Items.AddItem("        Item   C    ")
oG2antt.EndUpdate()
|
|
2054
|
How can I highlight the spaces within the column (sample 1)
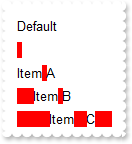
local oG2antt,var_Column,var_Items

oG2antt = form.EXG2ANTTCHARTACTIVEXCONTROL1.nativeObject
oG2antt.BeginUpdate()
oG2antt.ColumnAutoResize = true
var_Column = oG2antt.Columns.Add("Default")
	// var_Column.Def(17) = 1
	with (oG2antt)
		TemplateDef = [dim var_Column]
		TemplateDef = var_Column
		Template = [var_Column.Def(17) = 1]
	endwith
	var_Column.FormatColumn = "len(value) = 0 ? `<bgcolor=FF0000> </bgcolor>` : ( value replace ` ` with `<bgcolor=FF0000> </bgcolor>` )"
var_Items = oG2antt.Items
	var_Items.AddItem("")
	var_Items.AddItem("Item A")
	var_Items.AddItem("    Item B")
	var_Items.AddItem("        Item   C    ")
oG2antt.EndUpdate()
|
|
2053
|
How can I change the visual aspect of the drop down filter-calendar
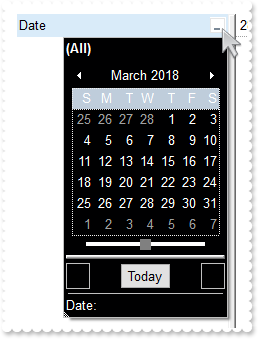
local oG2antt,var_Column

oG2antt = form.EXG2ANTTCHARTACTIVEXCONTROL1.nativeObject
oG2antt.BeginUpdate()
oG2antt.Template = [Background(26) = 65536] // oG2antt.Background(26) = 0x10000
oG2antt.Template = [Background(27) = 16777215] // oG2antt.Background(27) = 0xffffff
oG2antt.Template = [Background(12) = 16777215] // oG2antt.Background(12) = 0xffffff
oG2antt.Template = [Background(8) = Background(26)] // oG2antt.Background(8) = oG2antt.Background(26)
oG2antt.Template = [Background(11) = 8421504] // oG2antt.Background(11) = 0x808080
var_Column = oG2antt.Columns.Add("Date")
	var_Column.FilterType = 4
	var_Column.DisplayFilterButton = true
	var_Column.DisplayFilterDate = true
	var_Column.DisplayFilterPattern = false
oG2antt.EndUpdate()
|
|
2052
|
How can I scroll the chart to ensure that a bar fits the chart's client area
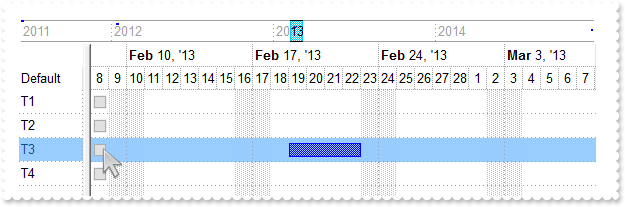
/*
with (this.EXG2ANTTCHARTACTIVEXCONTROL1.nativeObject)
	ButtonClick = class::nativeObject_ButtonClick
endwith
*/
// Occurs when user clicks on the cell's button.
function nativeObject_ButtonClick(Item, ColIndex, Key)
	local dEnd,dScroll,dStart,kBar
	oG2antt = form.EXG2ANTTCHARTACTIVEXCONTROL1.nativeObject
	kBar = oG2antt.Items.FirstItemBar(Item)
	dStart = oG2antt.Items.ItemBar(Item,kBar,1)
	dEnd = oG2antt.Items.ItemBar(Item,kBar,2)
	dScroll = oG2antt.FormatABC("(A+B)/2",dStart,dEnd)
	oG2antt.Chart.ScrollTo(dScroll,1)
return

local oG2antt,var_Chart,var_Column,var_Columns,var_Items

oG2antt = form.EXG2ANTTCHARTACTIVEXCONTROL1.nativeObject
oG2antt.BeginUpdate()
oG2antt.ShowFocusRect = false
oG2antt.DrawGridLines = -1
oG2antt.GridLineStyle = 3
oG2antt.SelBackMode = 1
var_Chart = oG2antt.Chart
	var_Chart.OverviewVisible = 6402 /*exOverviewShowDateTimeScaleBottom | exOverviewAllowVerticalScroll | exOverviewShowAllVisible*/
	var_Chart.OverviewHeight = 26
	var_Chart.FirstVisibleDate = "06/08/2011"
	var_Chart.AdjustLevelsToBase = true
	// var_Chart.PaneWidth(false) = 64
	with (oG2antt)
		TemplateDef = [dim var_Chart]
		TemplateDef = var_Chart
		Template = [var_Chart.PaneWidth(False) = 64]
	endwith
	var_Chart.UnitWidth = 14
	var_Chart.LevelCount = 2
	var_Chart.DrawGridLines = -1
	var_Chart.GridLineStyle = 3
	var_Chart.SelBackColor = oG2antt.SelBackColor
	var_Chart.ColumnsFormatLevel = "" + ["] + "" + ["] + ":2,(" + ["] + "" + ["] + "/14;1/" + ["] + "" + ["] + "):14"
var_Columns = oG2antt.Columns
	var_Columns.Add("Default")
	var_Column = var_Columns.Add("")
		// var_Column.Def(2) = true
		with (oG2antt)
			TemplateDef = [dim var_Column]
			TemplateDef = var_Column
			Template = [var_Column.Def(2) = True]
		endwith
		// var_Column.Def(4) = 15790320
		with (oG2antt)
			TemplateDef = [dim var_Column]
			TemplateDef = var_Column
			Template = [var_Column.Def(4) = 15790320]
		endwith
		var_Column.Visible = false
var_Items = oG2antt.Items
	var_Items.AddBar(var_Items.AddItem("T1"),"Task","06/09/2011","06/17/2011")
	var_Items.AddBar(var_Items.AddItem("T2"),"Task","01/10/2012","01/17/2012")
	var_Items.AddBar(var_Items.AddItem("T3"),"Task","02/19/2013","02/23/2013")
	var_Items.AddBar(var_Items.AddItem("T4"),"Task","12/19/2014","12/23/2014")
oG2antt.EndUpdate()
|
|
2051
|
Is it possible to hide completely the list portion
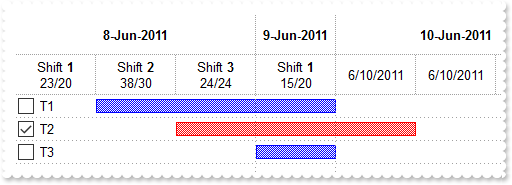
local oG2antt,var_Chart,var_Column,var_ConditionalFormat,var_InsideZooms,var_InsideZooms1,var_Items,var_Level,var_Level1

oG2antt = form.EXG2ANTTCHARTACTIVEXCONTROL1.nativeObject
oG2antt.BeginUpdate()
oG2antt.HeaderHeight = 32
oG2antt.OnResizeControl = 129 /*exDisableSplitter | exResizeChart*/
oG2antt.DrawGridLines = -1
var_ConditionalFormat = oG2antt.ConditionalFormats.Add("%CS0 = 1")
	var_ConditionalFormat.ApplyToBars = "Task"
	var_ConditionalFormat.BarColor = 0xff
var_Chart = oG2antt.Chart
	var_Chart.FirstVisibleDate = "06/08/2011"
	var_Chart.AdjustLevelsToBase = true
	// var_Chart.PaneWidth(false) = 0
	with (oG2antt)
		TemplateDef = [dim var_Chart]
		TemplateDef = var_Chart
		Template = [var_Chart.PaneWidth(False) = 0]
	endwith
	var_Chart.LevelCount = 2
	var_Chart.AllowInsideZoom = true
	var_Level = var_Chart.Level(0)
		var_Level.Alignment = 1
		var_Level.Label = "<b><%d%>-<%mmm%>-<%yyyy%>"
		var_Level.Unit = 4096
	var_Level1 = var_Chart.Level(1)
		var_Level1.Label = "<%h%>"
		var_Level1.Count = 8
		var_Level1.Unit = 65536
		var_Level1.FormatLabel = "date(int(dvalue)) case (#06/08/2011# : (int(value) case ( 0 : 'Shift <b>1</b><br>23/20'; 8 : 'Shift <b>2</b><br>38/30' ; 16 : 'Shift <b>3</b><br>24/24' ) ) ; #06/09/2011# : (int(value) case ( 0 : 'Shift <b>1</b><br>15/20'; 8 : 'Shift <b>2</b><br>30/32' ; 16 : 'Shift <b>3</b><br>26/24' ) ) )"
	var_Chart.UnitWidth = 64
	var_Chart.NonworkingDays = 0
	var_Chart.ColumnsFormatLevel = "0"
	var_Chart.AllowInsideZoom = true
	var_Chart.DefaultInsideZoomFormat.InsideUnit = 1048576
	var_Chart.AllowResizeInsideZoom = false
	var_Chart.InsideZoomOnDblClick = false
	var_InsideZooms = var_Chart.InsideZooms
		var_InsideZooms.SplitBaseLevel = false
		var_InsideZooms.DefaultWidth = 0
	var_InsideZooms1 = var_Chart.InsideZooms
		var_InsideZooms1.Add("06/09/2011 08:00:00")
		var_InsideZooms1.Add("06/09/2011 16:00:00")
	var_Chart.DrawGridLines = -1
	var_Chart.GridLineStyle = 3
// oG2antt.Columns.Add("Defaul").Def(0) = true
var_Column = oG2antt.Columns.Add("Defaul")
with (oG2antt)
	TemplateDef = [dim var_Column]
	TemplateDef = var_Column
	Template = [var_Column.Def(0) = True]
endwith
var_Items = oG2antt.Items
	var_Items.AddBar(var_Items.AddItem("T1"),"Task","06/08/2011 08:00:00","06/10/2011")
	var_Items.AddBar(var_Items.AddItem("T2"),"Task","06/08/2011 16:00:00","06/10/2011 08:00:00")
	var_Items.AddBar(var_Items.AddItem("T3"),"Task","06/09/2011","06/10/2011")
	// var_Items.CellState(var_Items.ItemByIndex(1),0) = 1
	with (oG2antt)
		TemplateDef = [dim var_Items]
		TemplateDef = var_Items
		Template = [var_Items.CellState(ItemByIndex(1),0) = 1]
	endwith
oG2antt.EndUpdate()
|
|
2050
|
How can I find out what exBarWorkingCount represents
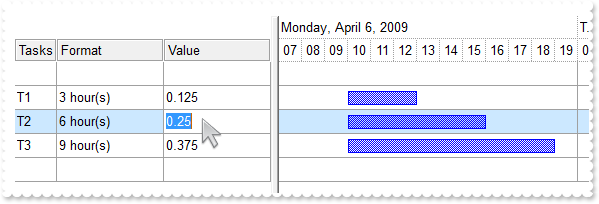
local h,oG2antt,var_Bar,var_Chart,var_Column,var_Column1,var_Column2,var_Items,var_Level

oG2antt = form.EXG2ANTTCHARTACTIVEXCONTROL1.nativeObject
oG2antt.BeginUpdate()
var_Column = oG2antt.Columns.Add("Tasks")
	var_Column.AllowSizing = false
	var_Column.Width = 42
var_Column1 = oG2antt.Columns.Add("Format")
	// var_Column1.Def(18) = 258
	with (oG2antt)
		TemplateDef = [dim var_Column1]
		TemplateDef = var_Column1
		Template = [var_Column1.Def(18) = 258]
	endwith
	var_Column1.FormatColumn = "trim((1:=int((0:=value)/365) ? =:1 + ` year(s) ` : ``)  + (1:=int((0:=(=:0 - (=:1*365)))/31) ? =:1 + ` month(s) ` : ``) + (1:=int((0:=(=:0 - (=:1*31)))/7) ? =:1 + ` week(s) ` : ``) + (1:=int((0:=(=:0 - (=:1*7)))/1) ? =:1 + ` day(s) ` : ``) + (1:=int((0:=(=:0 - =:1 + 1/24/60/60/2))*24) ? =:1 + ` hour(s) ` : ``) + (1:=int((0:=(=:0*24 - =:1))*60) ? =:1 + ` min(s) ` : ``) + (1:=int((0:=(=:0*60 - =:1))*60) ? =:1 + ` sec(s)` : ``))"
var_Column2 = oG2antt.Columns.Add("Value")
	// var_Column2.Def(18) = 258
	with (oG2antt)
		TemplateDef = [dim var_Column2]
		TemplateDef = var_Column2
		Template = [var_Column2.Def(18) = 258]
	endwith
	var_Column2.SortType = 1
	var_Column2.Editor.EditType = 1
oG2antt.HeaderAppearance = 4
oG2antt.DrawGridLines = -2
oG2antt.GridLineStyle = 48
oG2antt.SelBackColor = 0xffe8cc
oG2antt.SelForeColor = 0x0
var_Chart = oG2antt.Chart
	var_Chart.SelBackColor = oG2antt.SelBackColor
	var_Chart.FirstVisibleDate = "04/06/2009"
	// var_Chart.PaneWidth(false) = 256
	with (oG2antt)
		TemplateDef = [dim var_Chart]
		TemplateDef = var_Chart
		Template = [var_Chart.PaneWidth(False) = 256]
	endwith
	var_Chart.LevelCount = 2
	var_Chart.UnitScale = 65536
	var_Chart.NonworkingHours = 15728767
	var_Chart.ShowNonworkingDates = false
	var_Chart.ShowNonworkingUnits = false
	var_Chart.ShowNonworkingHours = false
	var_Bar = var_Chart.Bars.Item("Task")
		// var_Bar.Def(20) = true
		with (oG2antt)
			TemplateDef = [dim var_Bar]
			TemplateDef = var_Bar
			Template = [var_Bar.Def(20) = True]
		endwith
	var_Chart.AllowLinkBars = false
	var_Chart.DrawGridLines = -2
	var_Chart.GridLineStyle = 48
	// var_Chart.Level(0).DrawGridLines = true
	var_Level = var_Chart.Level(0)
	with (oG2antt)
		TemplateDef = [dim var_Level]
		TemplateDef = var_Level
		Template = [var_Level.DrawGridLines = True]
	endwith
	var_Chart.ResizeUnitScale = 1048576
	var_Chart.ResizeUnitCount = 15
	// var_Chart.Label(1048576) = "<|><%nn%><|><%h%>:<%nn%> <%AM/PM%><|><%d3%>, <%m3%> <%d%>, '<%yy%> <%h%>:<%nn%> <%AM/PM%><|><%dddd%>, <%mmmm%> <%d%>, <%yyyy%> <%h%>:<%nn%> <%AM/PM%><||>15"
	with (oG2antt)
		TemplateDef = [dim var_Chart]
		TemplateDef = var_Chart
		Template = [var_Chart.Label(1048576) = "<|><%nn%><|><%h%>:<%nn%> <%AM/PM%><|><%d3%>, <%m3%> <%d%>, '<%yy%> <%h%>:<%nn%> <%AM/PM%><|><%dddd%>, <%mmmm%> <%d%>, <%yyyy%> <%h%>:<%nn%> <%AM/PM%><||>15"]
	endwith
	var_Chart.AllowZoomOnFly = 280 /*exZoomOnFlyIncludeNeighborItems | exZoomOnFly*/
	var_Chart.BackColorZoomOnFly = 0xffff
oG2antt.Items.AllowCellValueToItemBar = true
var_Items = oG2antt.Items
	h = var_Items.AddItem("")
	// var_Items.SelectableItem(h) = false
	with (oG2antt)
		TemplateDef = [dim var_Items,h]
		TemplateDef = var_Items
		TemplateDef = h
		Template = [var_Items.SelectableItem(h) = False]
	endwith
	// var_Items.SortableItem(h) = false
	with (oG2antt)
		TemplateDef = [dim var_Items,h]
		TemplateDef = var_Items
		TemplateDef = h
		Template = [var_Items.SortableItem(h) = False]
	endwith
	var_Items.AddBar(var_Items.AddItem("T1"),"Task","04/06/2009 10:00:00","04/06/2009 13:00:00")
	var_Items.AddBar(var_Items.AddItem("T2"),"Task","04/06/2009 10:00:00","04/06/2009 16:00:00")
	var_Items.AddBar(var_Items.AddItem("T3"),"Task","04/06/2009 10:00:00","04/06/2009 19:00:00")
	h = var_Items.AddItem("")
	// var_Items.SelectableItem(h) = false
	with (oG2antt)
		TemplateDef = [dim var_Items,h]
		TemplateDef = var_Items
		TemplateDef = h
		Template = [var_Items.SelectableItem(h) = False]
	endwith
	// var_Items.SortableItem(h) = false
	with (oG2antt)
		TemplateDef = [dim var_Items,h]
		TemplateDef = var_Items
		TemplateDef = h
		Template = [var_Items.SortableItem(h) = False]
	endwith
oG2antt.EndUpdate()
|
|
2049
|
How can I hide the filter bar description
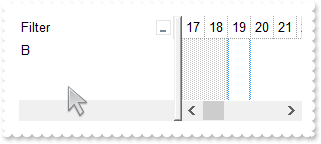
local oG2antt,var_Column,var_Items

oG2antt = form.EXG2ANTTCHARTACTIVEXCONTROL1.nativeObject
oG2antt.BeginUpdate()
var_Column = oG2antt.Columns.Add("Filter")
	var_Column.DisplayFilterButton = true
	var_Column.FilterType = 240
	var_Column.Filter = "B"
var_Items = oG2antt.Items
	var_Items.AddItem("A")
	var_Items.AddItem("B")
	var_Items.AddItem("C")
oG2antt.ApplyFilter()
oG2antt.FilterBarHeight = 0
oG2antt.EndUpdate()
|
|
2048
|
How can I add a break bar
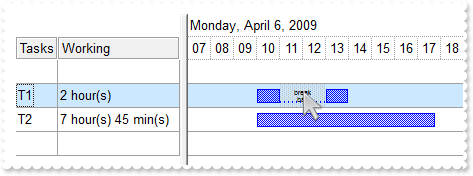
local h,oG2antt,var_Bar,var_Chart,var_Column,var_Column1,var_Items,var_Level

oG2antt = form.EXG2ANTTCHARTACTIVEXCONTROL1.nativeObject
oG2antt.BeginUpdate()
var_Column = oG2antt.Columns.Add("Tasks")
	var_Column.AllowSizing = false
	var_Column.Width = 42
var_Column1 = oG2antt.Columns.Add("Working")
	// var_Column1.Def(18) = 258
	with (oG2antt)
		TemplateDef = [dim var_Column1]
		TemplateDef = var_Column1
		Template = [var_Column1.Def(18) = 258]
	endwith
	var_Column1.FormatColumn = "((1:=int(0:= (value))) != 0 ? (=:1 + ' day(s)') : '') + (=:1 ? ' ' : '' ) + ((1:=int(0:=((=:0 - =:1 + 1/24/60/60/2)*24))) != 0 ? =:1 + ' hour(s)' : '' ) + (=:1 ? ' ' : '' ) + ((1:=round((=:0 - =:1)*60)) != 0 ? =:1 + ' min(s)' : '')"
oG2antt.HeaderAppearance = 4
oG2antt.DrawGridLines = -2
oG2antt.GridLineStyle = 48
oG2antt.SelBackColor = 0xffe8cc
oG2antt.SelForeColor = 0x0
var_Chart = oG2antt.Chart
	var_Chart.SelBackColor = oG2antt.SelBackColor
	var_Chart.FirstVisibleDate = "04/06/2009"
	// var_Chart.PaneWidth(false) = 164
	with (oG2antt)
		TemplateDef = [dim var_Chart]
		TemplateDef = var_Chart
		Template = [var_Chart.PaneWidth(False) = 164]
	endwith
	var_Chart.LevelCount = 2
	var_Chart.UnitScale = 65536
	var_Chart.NonworkingHours = 15728767
	var_Chart.ShowNonworkingDates = false
	var_Chart.ShowNonworkingUnits = false
	var_Chart.ShowNonworkingHours = false
	var_Bar = var_Chart.Bars.Add("Task:Split")
		// var_Bar.Def(20) = true
		with (oG2antt)
			TemplateDef = [dim var_Bar]
			TemplateDef = var_Bar
			Template = [var_Bar.Def(20) = True]
		endwith
		var_Bar.Shortcut = "Task"
	var_Chart.AllowLinkBars = false
	var_Chart.DrawGridLines = -2
	var_Chart.GridLineStyle = 48
	// var_Chart.Level(0).DrawGridLines = true
	var_Level = var_Chart.Level(0)
	with (oG2antt)
		TemplateDef = [dim var_Level]
		TemplateDef = var_Level
		Template = [var_Level.DrawGridLines = True]
	endwith
	var_Chart.ResizeUnitScale = 1048576
	var_Chart.ResizeUnitCount = 15
	// var_Chart.Label(1048576) = "<|><%nn%><|><%h%>:<%nn%> <%AM/PM%><|><%d3%>, <%m3%> <%d%>, '<%yy%> <%h%>:<%nn%> <%AM/PM%><|><%dddd%>, <%mmmm%> <%d%>, <%yyyy%> <%h%>:<%nn%> <%AM/PM%><||>15"
	with (oG2antt)
		TemplateDef = [dim var_Chart]
		TemplateDef = var_Chart
		Template = [var_Chart.Label(1048576) = "<|><%nn%><|><%h%>:<%nn%> <%AM/PM%><|><%d3%>, <%m3%> <%d%>, '<%yy%> <%h%>:<%nn%> <%AM/PM%><|><%dddd%>, <%mmmm%> <%d%>, <%yyyy%> <%h%>:<%nn%> <%AM/PM%><||>15"]
	endwith
	var_Chart.AllowZoomOnFly = 280 /*exZoomOnFlyIncludeNeighborItems | exZoomOnFly*/
	var_Chart.BackColorZoomOnFly = 0xffff
	var_Chart.AllowNonworkingBars = true
oG2antt.Items.AllowCellValueToItemBar = true
var_Items = oG2antt.Items
	var_Items.AddItem("")
	h = var_Items.AddItem("T1")
	// var_Items.ItemNonworkingUnits(h,false) = "(weekday(value) in (0,6)) or (timeF(value) < `07:00:00`) or (timeF(value) >= `20:00:00`) "
	with (oG2antt)
		TemplateDef = [dim var_Items,h]
		TemplateDef = var_Items
		TemplateDef = h
		Template = [var_Items.ItemNonworkingUnits(h,False) = "(weekday(value) in (0,6)) or (timeF(value) < `07:00:00`) or (timeF(value) >= `20:00:00`) "]
	endwith
	var_Items.AddBar(h,"","04/06/2009 07:30:00","04/06/2009 09:30:00","A","<c><font ;4>break<br>bar")
	// var_Items.ItemBar(h,"A",38) = true
	with (oG2antt)
		TemplateDef = [dim var_Items,h]
		TemplateDef = var_Items
		TemplateDef = h
		Template = [var_Items.ItemBar(h,"A",38) = True]
	endwith
	var_Items.AddBar(h,"Task","04/06/2009 10:00:00","04/06/2009 12:00:00")
	var_Items.AddBar(var_Items.AddItem("T2"),"Task","04/06/2009 10:00:00","04/06/2009 17:45:00")
	var_Items.AddItem("")
oG2antt.EndUpdate()
|
|
2047
|
It seems the ResizeUnitCount have no effect on the ZoomOnFly feature, is it normal
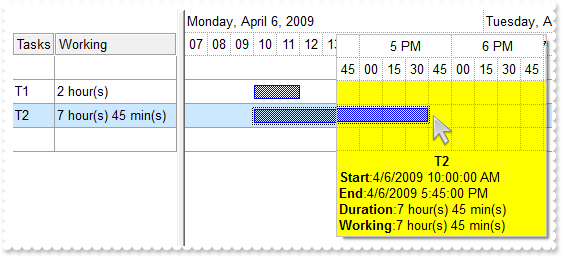
local oG2antt,var_Bar,var_Chart,var_Column,var_Column1,var_Items,var_Level

oG2antt = form.EXG2ANTTCHARTACTIVEXCONTROL1.nativeObject
oG2antt.BeginUpdate()
var_Column = oG2antt.Columns.Add("Tasks")
	var_Column.AllowSizing = false
	var_Column.Width = 42
var_Column1 = oG2antt.Columns.Add("Working")
	// var_Column1.Def(18) = 258
	with (oG2antt)
		TemplateDef = [dim var_Column1]
		TemplateDef = var_Column1
		Template = [var_Column1.Def(18) = 258]
	endwith
	var_Column1.FormatColumn = "((1:=int(0:= (value))) != 0 ? (=:1 + ' day(s)') : '') + (=:1 ? ' ' : '' ) + ((1:=int(0:=((=:0 - =:1 + 1/24/60/60/2)*24))) != 0 ? =:1 + ' hour(s)' : '' ) + (=:1 ? ' ' : '' ) + ((1:=round((=:0 - =:1)*60)) != 0 ? =:1 + ' min(s)' : '')"
oG2antt.HeaderAppearance = 4
oG2antt.DrawGridLines = -2
oG2antt.GridLineStyle = 48
oG2antt.SelBackColor = 0xffe8cc
oG2antt.SelForeColor = 0x0
var_Chart = oG2antt.Chart
	var_Chart.SelBackColor = oG2antt.SelBackColor
	var_Chart.FirstVisibleDate = "04/06/2009"
	// var_Chart.PaneWidth(false) = 164
	with (oG2antt)
		TemplateDef = [dim var_Chart]
		TemplateDef = var_Chart
		Template = [var_Chart.PaneWidth(False) = 164]
	endwith
	var_Chart.LevelCount = 2
	var_Chart.UnitScale = 65536
	var_Chart.NonworkingHours = 15728767
	var_Chart.ShowNonworkingDates = false
	var_Chart.ShowNonworkingUnits = false
	var_Chart.ShowNonworkingHours = false
	var_Bar = var_Chart.Bars.Item("Task")
		// var_Bar.Def(20) = true
		with (oG2antt)
			TemplateDef = [dim var_Bar]
			TemplateDef = var_Bar
			Template = [var_Bar.Def(20) = True]
		endwith
	var_Chart.AllowLinkBars = false
	var_Chart.DrawGridLines = -2
	var_Chart.GridLineStyle = 48
	// var_Chart.Level(0).DrawGridLines = true
	var_Level = var_Chart.Level(0)
	with (oG2antt)
		TemplateDef = [dim var_Level]
		TemplateDef = var_Level
		Template = [var_Level.DrawGridLines = True]
	endwith
	var_Chart.ResizeUnitScale = 1048576
	var_Chart.ResizeUnitCount = 15
	// var_Chart.Label(1048576) = "<|><%nn%><|><%h%>:<%nn%> <%AM/PM%><|><%d3%>, <%m3%> <%d%>, '<%yy%> <%h%>:<%nn%> <%AM/PM%><|><%dddd%>, <%mmmm%> <%d%>, <%yyyy%> <%h%>:<%nn%> <%AM/PM%><||>15"
	with (oG2antt)
		TemplateDef = [dim var_Chart]
		TemplateDef = var_Chart
		Template = [var_Chart.Label(1048576) = "<|><%nn%><|><%h%>:<%nn%> <%AM/PM%><|><%d3%>, <%m3%> <%d%>, '<%yy%> <%h%>:<%nn%> <%AM/PM%><|><%dddd%>, <%mmmm%> <%d%>, <%yyyy%> <%h%>:<%nn%> <%AM/PM%><||>15"]
	endwith
	var_Chart.AllowZoomOnFly = 280 /*exZoomOnFlyIncludeNeighborItems | exZoomOnFly*/
	var_Chart.BackColorZoomOnFly = 0xffff
oG2antt.Items.AllowCellValueToItemBar = true
var_Items = oG2antt.Items
	var_Items.AddItem("")
	var_Items.AddBar(var_Items.AddItem("T1"),"Task","04/06/2009 10:00:00","04/06/2009 12:00:00")
	var_Items.AddBar(var_Items.AddItem("T2"),"Task","04/06/2009 10:00:00","04/06/2009 17:45:00")
	var_Items.AddItem("")
oG2antt.EndUpdate()
|
|
2046
|
Export Data in HTML format
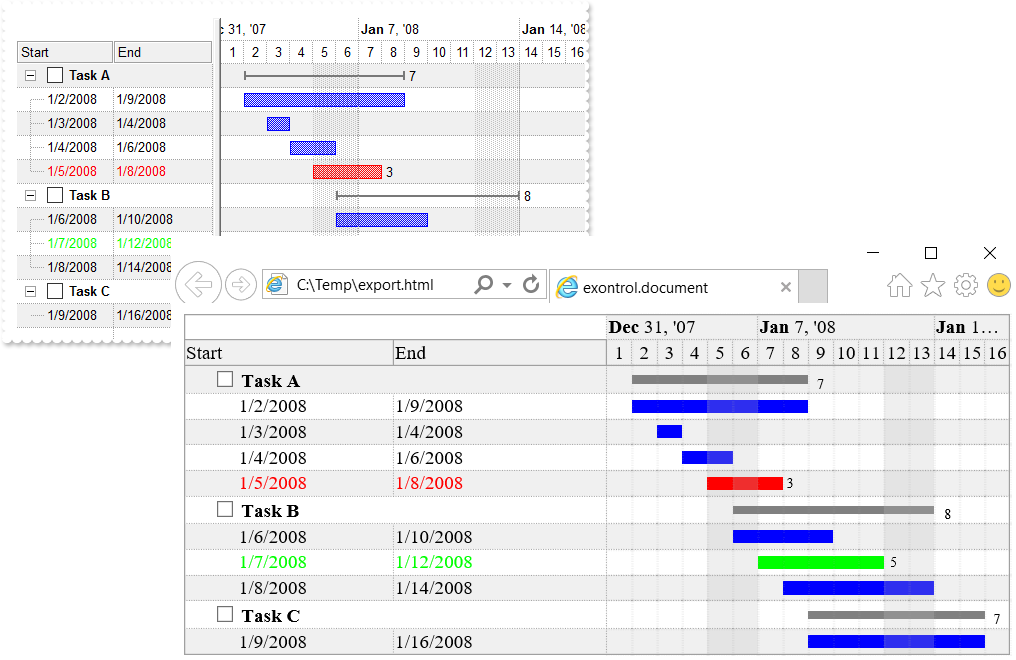
/*
with (this.EXG2ANTTCHARTACTIVEXCONTROL1.nativeObject)
	AddGroupItem = class::nativeObject_AddGroupItem
endwith
*/
// Occurs after a new Group Item has been inserted to Items collection.
function nativeObject_AddGroupItem(Item)
	local var_Items
	oG2antt = form.EXG2ANTTCHARTACTIVEXCONTROL1.nativeObject
	var_Items = oG2antt.Items
		// var_Items.ItemBold(Item) = true
		with (oG2antt)
			TemplateDef = [dim var_Items,Item]
			TemplateDef = var_Items
			TemplateDef = Item
			Template = [var_Items.ItemBold(Item) = True]
		endwith
		var_Items.AddBar(Item,"Summary",var_Items.CellValue(Item,2),var_Items.CellValue(Item,4))
		var_Items.DefineSummaryBars(Item,"",-3,"")
return

/*
with (this.EXG2ANTTCHARTACTIVEXCONTROL1.nativeObject)
	AddItem = class::nativeObject_AddItem
endwith
*/
// Occurs after a new Item has been inserted to Items collection.
function nativeObject_AddItem(Item)
	local i,var_Items
	oG2antt = form.EXG2ANTTCHARTACTIVEXCONTROL1.nativeObject
	var_Items = oG2antt.Items
		i = var_Items.ItemToIndex(Item)
		var_Items.AddBar(Item,"Task","01/02/2008","01/09/2008","")
		// var_Items.ItemBar(Item,"",514) = i
		with (oG2antt)
			TemplateDef = [dim var_Items,Item]
			TemplateDef = var_Items
			TemplateDef = Item
			Template = [var_Items.ItemBar(Item,"",514) = i]
		endwith
		// var_Items.ItemBar(Item,"",513) = i
		with (oG2antt)
			TemplateDef = [dim var_Items,Item]
			TemplateDef = var_Items
			TemplateDef = Item
			Template = [var_Items.ItemBar(Item,"",513) = i]
		endwith
return

local oG2antt,sFile,var_Appearance,var_Bar,var_Bar1,var_Chart,var_Column,var_Column1,var_Column2,var_Columns,var_ConditionalFormat,var_ConditionalFormat1,var_Items,var_ShellBrowserWindow

oG2antt = form.EXG2ANTTCHARTACTIVEXCONTROL1.nativeObject
oG2antt.BeginUpdate()
oG2antt.BackColorAlternate = 0xf0f0f0
oG2antt.DrawGridLines = -1
oG2antt.HeaderAppearance = 4
oG2antt.Template = [Description(11) = FormatABC("`<fgcolor=808080> ` + value + ` </fgcolor>`",Description(11))] // oG2antt.Description(11) = Str(oG2antt.FormatABC("`<fgcolor=808080> ` + value + ` </fgcolor>`",oG2antt.Description(11)))
oG2antt.FilterBarCaption = "(( ( value replace `[<b>` with `<bgcolor=000000><fgcolor=FFFFFF><b> ` replace `</b>]` with ` </b></bgcolor></fgcolor>` replace `[<s>` with `<bgcolor=C0C0C0><fgcolor=FFFFFF> ` replace `</s>]` with ` </fgcolor></bgcolor>` )  + `<r><fgcolor=808080>` + ( matchitemcount < 0 ? ( ( len(value) ? `` : `` ) + `<r>` + abs(matchitemcount + 1) + ` result(s)` ) : (`<r><fgcolor=808080>`+ itemcount + ` item(s)`) )))"
oG2antt.FilterBarPromptVisible = 2579 /*exFilterBarCompact | exFilterBarShowCloseIfRequired | exFilterBarSingleLine | exFilterBarVisible | exFilterBarPromptVisible*/
oG2antt.FilterBarPromptType = 2
oG2antt.SingleSort = false
oG2antt.AllowGroupBy = true
oG2antt.BackColorSortBar = oG2antt.BackColor
oG2antt.DrawGridLines = -1
var_Appearance = oG2antt.VisualAppearance
	var_Appearance.Add(1,"gBFLBCJwBAEHhEJAAEhABOUGACAADACAxRDgMQBQKAAzAJBIYhiG4cYCgMZhXDOCYXABCEYRXBIZQ7BKNIxjSJwFgmEgADCMQwAFBIbhrE4ZBjHGQRUgyI43RhHUBzVIUBxDEaTZLlEYJBgeHYhDJPcaUVDcWQHGyeZwjSgpKoWSJIU5NcggPDgEwTKCmKlTAKoSzJMyEmwWRAdVTZLSEaxierKPhyWT/XgAF4PfDFKRXFqXY5mKZJFqKOI8TxINgxPQMGyrBqraLqKwQGrGCQKSBhUZ3dS2JR3OSlYRuQAMVgOXoDZhPWZXbDtSzPE63NgtOR5DiGWalABoeoxRa9cz3ViCJSrGTqIoINIzZLHFQbPpdAYdP6BeIjXhhZxBBuLZXmEOh9CcNoni2N4MjWVodh+DpfBeLJinsWR9AyYwVAkGBhEAFphGiRogDEGBamkFgtjcZgHiMbgehYaQhAIEIREAaQYkcQZUHIGRUGQDBOEaBAhDYDxGkMZAkCgeoagYZAYEYAYIAWGhemICIFj8WIiCiFR5gkIhogmBoKGKJx2C6C5hniMgggqYwog0UoNGMZJiDiCZRgOLY0ECUAQICA==")
	var_Appearance.RenderType = -268435456
var_Chart = oG2antt.Chart
	var_Chart.DrawGridLines = -1
	// var_Chart.PaneWidth(false) = 196
	with (oG2antt)
		TemplateDef = [dim var_Chart]
		TemplateDef = var_Chart
		Template = [var_Chart.PaneWidth(False) = 196]
	endwith
	var_Chart.LevelCount = 2
	var_Chart.FirstVisibleDate = "01/01/2008"
	var_Chart.FirstWeekDay = 1
	var_Bar = var_Chart.Bars.Item("Summary")
		var_Bar.StartShape = 0
		var_Bar.EndShape = 0
		var_Bar.Shape = 1
		var_Bar.Color = 0x1808080
		var_Bar.Height = 7
		// var_Bar.Def(3) = "<%=%513%>"
		with (oG2antt)
			TemplateDef = [dim var_Bar]
			TemplateDef = var_Bar
			Template = [var_Bar.Def(3) = "<%=%513%>"]
		endwith
		// var_Bar.Def(4) = 18
		with (oG2antt)
			TemplateDef = [dim var_Bar]
			TemplateDef = var_Bar
			Template = [var_Bar.Def(4) = 18]
		endwith
	var_Bar1 = var_Chart.Bars.Item("Task")
		// var_Bar1.Def(3) = "<%=(%2-%1) in (3,5) ? %513 : `` %>"
		with (oG2antt)
			TemplateDef = [dim var_Bar1]
			TemplateDef = var_Bar1
			Template = [var_Bar1.Def(3) = "<%=(%2-%1) in (3,5) ? %513 : `` %>"]
		endwith
		// var_Bar1.Def(4) = 18
		with (oG2antt)
			TemplateDef = [dim var_Bar1]
			TemplateDef = var_Bar1
			Template = [var_Bar1.Def(4) = 18]
		endwith
var_ConditionalFormat = oG2antt.ConditionalFormats.Add("(%2 - %1) = 3","K3")
	var_ConditionalFormat.ForeColor = 0xff
	var_ConditionalFormat.BarColor = var_ConditionalFormat.ForeColor
	var_ConditionalFormat.ApplyToBars = "Task"
var_ConditionalFormat1 = oG2antt.ConditionalFormats.Add("(%2 - %1) = 5","K5")
	var_ConditionalFormat1.ForeColor = 0xff00
	var_ConditionalFormat1.BarColor = var_ConditionalFormat1.ForeColor
	var_ConditionalFormat1.ApplyToBars = "Task"
var_Columns = oG2antt.Columns
	// var_Columns.Add("Tasks").Def(0) = true
	var_Column = var_Columns.Add("Tasks")
	with (oG2antt)
		TemplateDef = [dim var_Column]
		TemplateDef = var_Column
		Template = [var_Column.Def(0) = True]
	endwith
	var_Column1 = var_Columns.Add("Start")
		// var_Column1.Def(18) = 1
		with (oG2antt)
			TemplateDef = [dim var_Column1]
			TemplateDef = var_Column1
			Template = [var_Column1.Def(18) = 1]
		endwith
		// var_Column1.Def(19) = ""
		with (oG2antt)
			TemplateDef = [dim var_Column1]
			TemplateDef = var_Column1
			Template = [var_Column1.Def(19) = ""]
		endwith
	var_Column2 = var_Columns.Add("End")
		// var_Column2.Def(18) = 2
		with (oG2antt)
			TemplateDef = [dim var_Column2]
			TemplateDef = var_Column2
			Template = [var_Column2.Def(18) = 2]
		endwith
		// var_Column2.Def(19) = ""
		with (oG2antt)
			TemplateDef = [dim var_Column2]
			TemplateDef = var_Column2
			Template = [var_Column2.Def(19) = ""]
		endwith
var_Items = oG2antt.Items
	var_Items.AllowCellValueToItemBar = true
	var_Items.AddItem("Task A")
	var_Items.AddItem("Task A")
	var_Items.AddItem("Task A")
	var_Items.AddItem("Task A")
	var_Items.AddItem("Task B")
	var_Items.AddItem("Task B")
	var_Items.AddItem("Task B")
	var_Items.AddItem("Task C")
oG2antt.Columns.Item("Tasks").SortOrder = 1
oG2antt.EndUpdate()
sFile = "c:/temp/export.html"
oG2antt.Export(sFile,"vis")
var_ShellBrowserWindow = new OleAutoClient("InternetExplorer.Application")
	var_ShellBrowserWindow.Navigate2(sFile)
|
|
2045
|
Export Data in CSV format
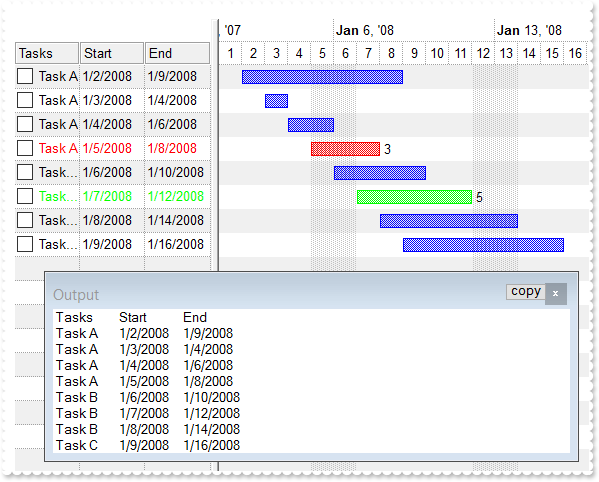
/*
with (this.EXG2ANTTCHARTACTIVEXCONTROL1.nativeObject)
	AddItem = class::nativeObject_AddItem
endwith
*/
// Occurs after a new Item has been inserted to Items collection.
function nativeObject_AddItem(Item)
	local i,var_Items
	oG2antt = form.EXG2ANTTCHARTACTIVEXCONTROL1.nativeObject
	var_Items = oG2antt.Items
		i = var_Items.ItemToIndex(Item)
		var_Items.AddBar(Item,"Task","01/02/2008","01/09/2008","")
		// var_Items.ItemBar(Item,"",514) = i
		with (oG2antt)
			TemplateDef = [dim var_Items,Item]
			TemplateDef = var_Items
			TemplateDef = Item
			Template = [var_Items.ItemBar(Item,"",514) = i]
		endwith
		// var_Items.ItemBar(Item,"",513) = i
		with (oG2antt)
			TemplateDef = [dim var_Items,Item]
			TemplateDef = var_Items
			TemplateDef = Item
			Template = [var_Items.ItemBar(Item,"",513) = i]
		endwith
return

local oG2antt,var_Bar,var_Chart,var_Column,var_Column1,var_Column2,var_Columns,var_ConditionalFormat,var_ConditionalFormat1,var_Items

oG2antt = form.EXG2ANTTCHARTACTIVEXCONTROL1.nativeObject
oG2antt.BeginUpdate()
oG2antt.BackColorAlternate = 0xf0f0f0
oG2antt.DrawGridLines = -1
oG2antt.HeaderAppearance = 4
oG2antt.Template = [Description(11) = FormatABC("`<fgcolor=808080> ` + value + ` </fgcolor>`",Description(11))] // oG2antt.Description(11) = Str(oG2antt.FormatABC("`<fgcolor=808080> ` + value + ` </fgcolor>`",oG2antt.Description(11)))
oG2antt.FilterBarCaption = "(( ( value replace `[<b>` with `<bgcolor=000000><fgcolor=FFFFFF><b> ` replace `</b>]` with ` </b></bgcolor></fgcolor>` replace `[<s>` with `<bgcolor=C0C0C0><fgcolor=FFFFFF> ` replace `</s>]` with ` </fgcolor></bgcolor>` )  + `<r><fgcolor=808080>` + ( matchitemcount < 0 ? ( ( len(value) ? `` : `` ) + `<r>` + abs(matchitemcount + 1) + ` result(s)` ) : (`<r><fgcolor=808080>`+ itemcount + ` item(s)`) )))"
oG2antt.FilterBarPromptVisible = 2579 /*exFilterBarCompact | exFilterBarShowCloseIfRequired | exFilterBarSingleLine | exFilterBarVisible | exFilterBarPromptVisible*/
oG2antt.FilterBarPromptType = 2
var_Chart = oG2antt.Chart
	// var_Chart.PaneWidth(false) = 196
	with (oG2antt)
		TemplateDef = [dim var_Chart]
		TemplateDef = var_Chart
		Template = [var_Chart.PaneWidth(False) = 196]
	endwith
	var_Chart.LevelCount = 2
	var_Chart.FirstVisibleDate = "01/01/2008"
	var_Bar = var_Chart.Bars.Item("Task")
		// var_Bar.Def(3) = "<%=(%2-%1) in (3,5) ? %513 : `` %>"
		with (oG2antt)
			TemplateDef = [dim var_Bar]
			TemplateDef = var_Bar
			Template = [var_Bar.Def(3) = "<%=(%2-%1) in (3,5) ? %513 : `` %>"]
		endwith
		// var_Bar.Def(4) = 18
		with (oG2antt)
			TemplateDef = [dim var_Bar]
			TemplateDef = var_Bar
			Template = [var_Bar.Def(4) = 18]
		endwith
var_ConditionalFormat = oG2antt.ConditionalFormats.Add("(%2 - %1) = 3","K3")
	var_ConditionalFormat.ForeColor = 0xff
	var_ConditionalFormat.BarColor = var_ConditionalFormat.ForeColor
	var_ConditionalFormat.ApplyToBars = "Task"
var_ConditionalFormat1 = oG2antt.ConditionalFormats.Add("(%2 - %1) = 5","K5")
	var_ConditionalFormat1.ForeColor = 0xff00
	var_ConditionalFormat1.BarColor = var_ConditionalFormat1.ForeColor
	var_ConditionalFormat1.ApplyToBars = "Task"
var_Columns = oG2antt.Columns
	// var_Columns.Add("Tasks").Def(0) = true
	var_Column = var_Columns.Add("Tasks")
	with (oG2antt)
		TemplateDef = [dim var_Column]
		TemplateDef = var_Column
		Template = [var_Column.Def(0) = True]
	endwith
	var_Column1 = var_Columns.Add("Start")
		// var_Column1.Def(18) = 1
		with (oG2antt)
			TemplateDef = [dim var_Column1]
			TemplateDef = var_Column1
			Template = [var_Column1.Def(18) = 1]
		endwith
		// var_Column1.Def(19) = ""
		with (oG2antt)
			TemplateDef = [dim var_Column1]
			TemplateDef = var_Column1
			Template = [var_Column1.Def(19) = ""]
		endwith
	var_Column2 = var_Columns.Add("End")
		// var_Column2.Def(18) = 2
		with (oG2antt)
			TemplateDef = [dim var_Column2]
			TemplateDef = var_Column2
			Template = [var_Column2.Def(18) = 2]
		endwith
		// var_Column2.Def(19) = ""
		with (oG2antt)
			TemplateDef = [dim var_Column2]
			TemplateDef = var_Column2
			Template = [var_Column2.Def(19) = ""]
		endwith
var_Items = oG2antt.Items
	var_Items.AllowCellValueToItemBar = true
	var_Items.AddItem("Task A")
	var_Items.AddItem("Task A")
	var_Items.AddItem("Task A")
	var_Items.AddItem("Task A")
	var_Items.AddItem("Task B")
	var_Items.AddItem("Task B")
	var_Items.AddItem("Task B")
	var_Items.AddItem("Task C")
oG2antt.EndUpdate()
? Str(oG2antt.Export("","vis"))
|
|
2044
|
I want to be able to detect when a user clicks on a row in the chart that is not populated
/*
with (this.EXG2ANTTCHARTACTIVEXCONTROL1.nativeObject)
	MouseMove = class::nativeObject_MouseMove
endwith
*/
// Occurs when the user moves the mouse.
function nativeObject_MouseMove(Button, Shift, X, Y)
	local date,item,sMessage
	oG2antt = form.EXG2ANTTCHARTACTIVEXCONTROL1.nativeObject
	item = oG2antt.ItemFromPoint(-1,-1,col,hit)
	date = oG2antt.Chart.DateFromPoint(-1,-1)
	sMessage = oG2antt.FormatABC("(not(A = 0) ? `chart` : `list`) + ` ` + (not(B = 0) ? `item` : `empty`)  ",date,item)
	? Str(sMessage)
return

local oG2antt,var_Chart,var_Items

oG2antt = form.EXG2ANTTCHARTACTIVEXCONTROL1.nativeObject
oG2antt.BeginUpdate()
var_Chart = oG2antt.Chart
	// var_Chart.PaneWidth(false) = 128
	with (oG2antt)
		TemplateDef = [dim var_Chart]
		TemplateDef = var_Chart
		Template = [var_Chart.PaneWidth(False) = 128]
	endwith
	var_Chart.LevelCount = 2
	var_Chart.FirstVisibleDate = "01/01/2018"
oG2antt.Columns.Add("Tasks")
var_Items = oG2antt.Items
	var_Items.AddBar(var_Items.AddItem("Task 1"),"Task","01/02/2018","01/12/2018")
	var_Items.AddBar(var_Items.AddItem("Task 2"),"Task","01/03/2018","01/13/2018")
	var_Items.AddBar(var_Items.AddItem("Task 3"),"Task","01/04/2018","01/14/2018")
oG2antt.EndUpdate()
|
|
2043
|
Is it possible to have multiple calendars. A calendar for each row for example. Reason : some of our lines work 2 shifts but some also have a night shift
local h,oG2antt,sCalendar1,sCalendar2,sCalendar3,sCalendar4,var_Bar,var_Bar1,var_Bars,var_Chart,var_Column,var_Items,var_Level,var_Level1

oG2antt = form.EXG2ANTTCHARTACTIVEXCONTROL1.nativeObject
oG2antt.BeginUpdate()
oG2antt.Columns.Add("Tasks")
var_Column = oG2antt.Columns.Add("Working")
	// var_Column.Def(18) = 258
	with (oG2antt)
		TemplateDef = [dim var_Column]
		TemplateDef = var_Column
		Template = [var_Column.Def(18) = 258]
	endwith
	var_Column.FormatColumn = "((1:=int(0:=( 24*int(value) + (value - int(value) + 1/24/60/60/2)*24))) != 0 ? =:1 + ' hour(s)' : '' ) + (=:1 ? ' ' : '' ) + ((1:=round((=:0 - =:1)*60)) != 0 ? =:1 + ' min(s)' : '')"
var_Chart = oG2antt.Chart
	var_Chart.FirstVisibleDate = "04/06/2009"
	// var_Chart.PaneWidth(false) = 148
	with (oG2antt)
		TemplateDef = [dim var_Chart]
		TemplateDef = var_Chart
		Template = [var_Chart.PaneWidth(False) = 148]
	endwith
	var_Chart.LevelCount = 2
	var_Chart.ShowNonworkingUnits = false
	var_Chart.ShowNonworkingDates = false
	var_Bars = var_Chart.Bars
		// var_Bars.Add("Task:Split").Shortcut = "Task"
		var_Bar = var_Bars.Add("Task:Split")
		with (oG2antt)
			TemplateDef = [dim var_Bar]
			TemplateDef = var_Bar
			Template = [var_Bar.Shortcut = "Task"]
		endwith
		// var_Bars.Item("Task").Def(20) = true
		var_Bar1 = var_Bars.Item("Task")
		with (oG2antt)
			TemplateDef = [dim var_Bar1]
			TemplateDef = var_Bar1
			Template = [var_Bar1.Def(20) = True]
		endwith
	// var_Chart.Label(65536) = "<%h%><||><||>65536"
	with (oG2antt)
		TemplateDef = [dim var_Chart]
		TemplateDef = var_Chart
		Template = [var_Chart.Label(65536) = "<%h%><||><||>65536"]
	endwith
	// var_Chart.Level(0).FormatLabel = "`<font small fonts;6>` + value"
	var_Level = var_Chart.Level(0)
	with (oG2antt)
		TemplateDef = [dim var_Level]
		TemplateDef = var_Level
		Template = [var_Level.FormatLabel = "`<font small fonts;6>` + value"]
	endwith
	// var_Chart.Level(1).FormatLabel = "len(value) = 2 ? (`<font small fonts;4>` + (value left 1) + `<br>` + (value right 1) ) : (`<font small fonts;4>` + ` <br>` + (value left 1) + `` )"
	var_Level1 = var_Chart.Level(1)
	with (oG2antt)
		TemplateDef = [dim var_Level1]
		TemplateDef = var_Level1
		Template = [var_Level1.FormatLabel = "len(value) = 2 ? (`<font small fonts;4>` + (value left 1) + `<br>` + (value right 1) ) : (`<font small fonts;4>` + ` <br>` + (value left 1) + `` )"]
	endwith
	var_Chart.UnitScale = 65536
	var_Chart.UnitWidth = 9
oG2antt.Items.AllowCellValueToItemBar = true
var_Items = oG2antt.Items
	sCalendar1 = "weekday(value) in (0,6) or (hour(value) < 6) or (hour(value) > 18)"
	h = var_Items.AddItem("Shift 1")
	// var_Items.ItemNonworkingUnits(h,false) = Str(sCalendar1)
	with (oG2antt)
		TemplateDef = [dim var_Items,h]
		TemplateDef = var_Items
		TemplateDef = h
		Template = [var_Items.ItemNonworkingUnits(h,False) = sCalendar1]
	endwith
	var_Items.AddBar(h,"Task","04/06/2009","04/07/2009")
	h = var_Items.AddItem("Shift 1")
	// var_Items.ItemNonworkingUnits(h,false) = Str(sCalendar1)
	with (oG2antt)
		TemplateDef = [dim var_Items,h]
		TemplateDef = var_Items
		TemplateDef = h
		Template = [var_Items.ItemNonworkingUnits(h,False) = sCalendar1]
	endwith
	var_Items.AddBar(h,"Task","04/06/2009","04/08/2009")
	sCalendar2 = "weekday(value) in (0,6) or (hour(value) < 8) or (hour(value) > 14)"
	h = var_Items.AddItem("Shift 2")
	// var_Items.ItemNonworkingUnits(h,false) = Str(sCalendar2)
	with (oG2antt)
		TemplateDef = [dim var_Items,h]
		TemplateDef = var_Items
		TemplateDef = h
		Template = [var_Items.ItemNonworkingUnits(h,False) = sCalendar2]
	endwith
	var_Items.AddBar(h,"Task","04/06/2009","04/07/2009")
	h = var_Items.AddItem("Shift 2")
	// var_Items.ItemNonworkingUnits(h,false) = Str(sCalendar2)
	with (oG2antt)
		TemplateDef = [dim var_Items,h]
		TemplateDef = var_Items
		TemplateDef = h
		Template = [var_Items.ItemNonworkingUnits(h,False) = sCalendar2]
	endwith
	var_Items.AddBar(h,"Task","04/06/2009","04/08/2009")
	sCalendar3 = "weekday(value) in (0,6) or 0 = ( hour(value) mod 3 ) "
	h = var_Items.AddItem("Shift 3")
	// var_Items.ItemNonworkingUnits(h,false) = Str(sCalendar3)
	with (oG2antt)
		TemplateDef = [dim var_Items,h]
		TemplateDef = var_Items
		TemplateDef = h
		Template = [var_Items.ItemNonworkingUnits(h,False) = sCalendar3]
	endwith
	var_Items.AddBar(h,"Task","04/06/2009","04/07/2009")
	h = var_Items.AddItem("Shift 3")
	// var_Items.ItemNonworkingUnits(h,false) = Str(sCalendar3)
	with (oG2antt)
		TemplateDef = [dim var_Items,h]
		TemplateDef = var_Items
		TemplateDef = h
		Template = [var_Items.ItemNonworkingUnits(h,False) = sCalendar3]
	endwith
	var_Items.AddBar(h,"Task","04/06/2009","04/08/2009")
	sCalendar4 = "weekday(value) in (0,6)"
	h = var_Items.AddItem("Shift 3")
	// var_Items.ItemNonworkingUnits(h,false) = Str(sCalendar4)
	with (oG2antt)
		TemplateDef = [dim var_Items,h]
		TemplateDef = var_Items
		TemplateDef = h
		Template = [var_Items.ItemNonworkingUnits(h,False) = sCalendar4]
	endwith
	var_Items.AddBar(h,"Task","04/06/2009","04/07/2009")
	h = var_Items.AddItem("Shift 3")
	// var_Items.ItemNonworkingUnits(h,false) = Str(sCalendar4)
	with (oG2antt)
		TemplateDef = [dim var_Items,h]
		TemplateDef = var_Items
		TemplateDef = h
		Template = [var_Items.ItemNonworkingUnits(h,False) = sCalendar4]
	endwith
	var_Items.AddBar(h,"Task","04/06/2009","04/08/2009")
oG2antt.EndUpdate()
|
|
2042
|
Is it possible to check multiple-items at once
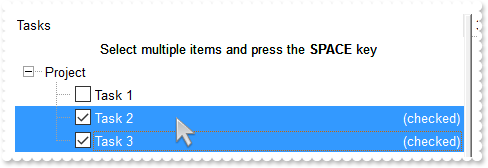
/*
with (this.EXG2ANTTCHARTACTIVEXCONTROL1.nativeObject)
	AddItem = class::nativeObject_AddItem
endwith
*/
// Occurs after a new Item has been inserted to Items collection.
function nativeObject_AddItem(Item)
	local bHasParent,var_Items
	oG2antt = form.EXG2ANTTCHARTACTIVEXCONTROL1.nativeObject
	bHasParent = oG2antt.FormatABC("value != 0",oG2antt.Items.ItemParent(Item))
	var_Items = oG2antt.Items
		// var_Items.CellHasCheckBox(Item,0) = false
		with (oG2antt)
			TemplateDef = [dim var_Items,Item]
			TemplateDef = var_Items
			TemplateDef = Item
			Template = [var_Items.CellHasCheckBox(Item,0) = bHasParent]
		endwith
return

local h,hChild,oG2antt,var_Column,var_Items

oG2antt = form.EXG2ANTTCHARTACTIVEXCONTROL1.nativeObject
oG2antt.BeginUpdate()
oG2antt.LinesAtRoot = -1
var_Column = oG2antt.Columns.Add("Tasks")
	// var_Column.Def(17) = 1
	with (oG2antt)
		TemplateDef = [dim var_Column]
		TemplateDef = var_Column
		Template = [var_Column.Def(17) = 1]
	endwith
	var_Column.FormatColumn = "value + (%CS0 = 1 ? `<r><fgcolor=808080>(checked)` : ``)"
oG2antt.HeaderVisible = 1
oG2antt.SingleSel = false
var_Items = oG2antt.Items
	h = var_Items.AddItem("Project")
	hChild = var_Items.InsertItem(h,null,"Task 1")
	hChild = var_Items.InsertItem(h,null,"Task 2")
	hChild = var_Items.InsertItem(h,null,"Task 3")
	// var_Items.ExpandItem(h) = true
	with (oG2antt)
		TemplateDef = [dim var_Items,h]
		TemplateDef = var_Items
		TemplateDef = h
		Template = [var_Items.ExpandItem(h) = True]
	endwith
	// var_Items.LockedItemCount(0) = 1
	with (oG2antt)
		TemplateDef = [dim var_Items]
		TemplateDef = var_Items
		Template = [var_Items.LockedItemCount(0) = 1]
	endwith
	// var_Items.CellValue(var_Items.LockedItem(0,0),0) = "<c>Select multiple items and press the <b>SPACE</b> key"
	with (oG2antt)
		TemplateDef = [dim var_Items]
		TemplateDef = var_Items
		Template = [var_Items.CellValue(LockedItem(0,0),0) = "<c>Select multiple items and press the <b>SPACE</b> key"]
	endwith
oG2antt.EndUpdate()
|
|
2041
|
How can I prevent changing the start/end colors of the bar, when ItemBar(exBarColor) property is applied
local h,oG2antt,var_Bar,var_Bar1,var_Bars,var_Chart,var_Items

oG2antt = form.EXG2ANTTCHARTACTIVEXCONTROL1.nativeObject
oG2antt.BeginUpdate()
oG2antt.Images("gBJJgBAIDAAGAAEAAQhYAf8Pf4hh0QihCJo2AEZjQAjEZFEaIEaEEaAIAkcbk0olUrlktl0vmExmUzmk1m03nE5nU7nk9n0/oFBoVDolFo1HpFJpVLplNp1PqFRqVTqlVq1XrFZrVbrldr1fsFhsVjslls1ntFptVrtltt1vuFxuVzul1u13vF5vV7vl9v1/wGBwWDwmFw2HxGJxWLxmNx0xiFdyOTh8Tf9ZymXx+QytcyNgz8r0OblWjyWds+m0ka1Vf1ta1+r1mos2xrG2xeZ0+a0W0qOx3GO4NV3WeyvD2XJ5XL5nN51aiw+lfSj0gkUkAEllHanHI5j/cHg8EZf7w8vl8j4f/qfEZeB09/vjLAB30+kZQAP/P5/H6/yNAOAEAwCjMBwFAEDwJBMDwLBYAP2/8Hv8/gAGAD8LQs9w/nhDY/oygIA=")
oG2antt.VisualAppearance.Add(1,"E:\Exontrol\ExButton\sample\EBN\Assorted\bhframe.ebn")
// oG2antt.Chart.PaneWidth(false) = 96
var_Chart = oG2antt.Chart
with (oG2antt)
	TemplateDef = [dim var_Chart]
	TemplateDef = var_Chart
	Template = [var_Chart.PaneWidth(False) = 96]
endwith
var_Bars = oG2antt.Chart.Bars
	var_Bars.AddShapeCorner(12345,1)
	var_Bars.AddShapeCorner(999,2)
	var_Bars.AddShapeCorner(1049,3)
	var_Bar = var_Bars.Add("T1")
		var_Bar.StartShape = 12345 /*0x3020 | exShapeIconVBar | exShapeIconRight*/
		var_Bar.EndShape = 999 /*0x3e0 | exShapeIconLeft*/
		var_Bar.Pattern = 4
		var_Bar.StartColor = 0xff00
		var_Bar.Color = 0x1000000
		var_Bar.EndColor = 0xff
		// var_Bar.Def(3) = "<%=`<font ;6>  ` + %0 + ``%>"
		with (oG2antt)
			TemplateDef = [dim var_Bar]
			TemplateDef = var_Bar
			Template = [var_Bar.Def(3) = "<%=`<font ;6>  ` + %0 + ``%>"]
		endwith
		// var_Bar.Def(4) = 18
		with (oG2antt)
			TemplateDef = [dim var_Bar]
			TemplateDef = var_Bar
			Template = [var_Bar.Def(4) = 18]
		endwith
	var_Bar1 = var_Bars.Add("T2")
		var_Bar1.StartShape = 12345 /*0x3020 | exShapeIconVBar | exShapeIconRight*/
		var_Bar1.EndShape = 1049 /*0x400 | exShapeIconVBar | exShapeIconRight*/
		var_Bar1.Pattern = 4
		var_Bar1.StartColor = -1
		var_Bar1.Color = 0x1000000
		var_Bar1.EndColor = -1
		// var_Bar1.Def(3) = "<%=`<font ;6>  ` + %0 + ``%>"
		with (oG2antt)
			TemplateDef = [dim var_Bar1]
			TemplateDef = var_Bar1
			Template = [var_Bar1.Def(3) = "<%=`<font ;6>  ` + %0 + ``%>"]
		endwith
		// var_Bar1.Def(4) = 18
		with (oG2antt)
			TemplateDef = [dim var_Bar1]
			TemplateDef = var_Bar1
			Template = [var_Bar1.Def(4) = 18]
		endwith
oG2antt.Chart.FirstVisibleDate = "01/01/2001"
oG2antt.Columns.Add("Column")
var_Items = oG2antt.Items
	h = var_Items.AddItem("Item 1")
	var_Items.AddBar(h,"T1","01/02/2001","01/04/2001")
	h = var_Items.AddItem("Item 2")
	var_Items.AddBar(h,"T1","01/02/2001","01/04/2001")
	// var_Items.ItemBar(h,"",33) = 65280
	with (oG2antt)
		TemplateDef = [dim var_Items,h]
		TemplateDef = var_Items
		TemplateDef = h
		Template = [var_Items.ItemBar(h,"",33) = 65280]
	endwith
	h = var_Items.AddItem("Item 3")
	var_Items.AddBar(h,"T1","01/02/2001","01/04/2001")
	// var_Items.ItemBar(h,"",33) = 255
	with (oG2antt)
		TemplateDef = [dim var_Items,h]
		TemplateDef = var_Items
		TemplateDef = h
		Template = [var_Items.ItemBar(h,"",33) = 255]
	endwith
	h = var_Items.AddItem("Item 4")
	var_Items.AddBar(h,"T2","01/02/2001","01/04/2001")
	h = var_Items.AddItem("Item 5")
	var_Items.AddBar(h,"T2","01/02/2001","01/04/2001")
	// var_Items.ItemBar(h,"",33) = 65280
	with (oG2antt)
		TemplateDef = [dim var_Items,h]
		TemplateDef = var_Items
		TemplateDef = h
		Template = [var_Items.ItemBar(h,"",33) = 65280]
	endwith
	h = var_Items.AddItem("Item 6")
	var_Items.AddBar(h,"T2","01/02/2001","01/04/2001")
	// var_Items.ItemBar(h,"",33) = 255
	with (oG2antt)
		TemplateDef = [dim var_Items,h]
		TemplateDef = var_Items
		TemplateDef = h
		Template = [var_Items.ItemBar(h,"",33) = 255]
	endwith
oG2antt.EndUpdate()
|
|
2040
|
How can I get the icon from the cell when using the Items.CellImages property (icon index)
/*
with (this.EXG2ANTTCHARTACTIVEXCONTROL1.nativeObject)
	MouseMove = class::nativeObject_MouseMove
endwith
*/
// Occurs when the user moves the mouse.
function nativeObject_MouseMove(Button, Shift, X, Y)
	local i
	oG2antt = form.EXG2ANTTCHARTACTIVEXCONTROL1.nativeObject
	i = oG2antt.ItemFromPoint(-1,-1,c,hit)
	? Str(oG2antt.FormatABC("( 0x44 = ( value bitand 0x44 ) ) ? ( ( (value bitand 0xFFFF0000) bitshift 16 ) array B split `,` )  : `no image`",hit,oG2antt.Items.CellImages(i,c)))
return

local oG2antt,var_Chart,var_Items

oG2antt = form.EXG2ANTTCHARTACTIVEXCONTROL1.nativeObject
oG2antt.BeginUpdate()
oG2antt.Images("gBJJgBAIDAAGAAEAAQhYAf8Pf4hh0QihCJo2AEZjQAjEZFEaIEaEEaAIAkcbk0olUrlktl0vmExmUzmk1m03nE5nU7nk9n0/oFBoVDolFo1HpFJpVLplNp1PqFRqVTqlVq1XrFZrVbrldr1fsFhsVjslls1ntFptVrtltt1vuFxuVzul1u13vF5vV7vl9v1/wGBwWDwmFw2HxGJxWLxmNx0xiFdyOTh8Tf9ZymXx+QytcyNgz8r0OblWjyWds+m0ka1Vf1ta1+r1mos2xrG2xeZ0+a0W0qOx3GO4NV3WeyvD2XJ5XL5nN51aiw+lfSj0gkUkAEllHanHI5j/cHg8EZf7w8vl8j4f/qfEZeB09/vjLAB30+kZQAP/P5/H6/yNAOAEAwCjMBwFAEDwJBMDwLBYAP2/8Hv8/gAGAD8LQs9w/nhDY/oygIA=")
// oG2antt.Chart.PaneWidth(true) = 0
var_Chart = oG2antt.Chart
with (oG2antt)
	TemplateDef = [dim var_Chart]
	TemplateDef = var_Chart
	Template = [var_Chart.PaneWidth(True) = 0]
endwith
oG2antt.Columns.Add("Default")
var_Items = oG2antt.Items
	// var_Items.CellImages(var_Items.AddItem("Item 1"),0) = "3,2,1"
	with (oG2antt)
		TemplateDef = [dim var_Items]
		TemplateDef = var_Items
		Template = [var_Items.CellImages(AddItem("Item 1"),0) = "3,2,1"]
	endwith
	// var_Items.CellImages(var_Items.AddItem("Item 2"),0) = "2,3"
	with (oG2antt)
		TemplateDef = [dim var_Items]
		TemplateDef = var_Items
		Template = [var_Items.CellImages(AddItem("Item 2"),0) = "2,3"]
	endwith
	// var_Items.CellImages(var_Items.AddItem("Item 3"),0) = "2,"
	with (oG2antt)
		TemplateDef = [dim var_Items]
		TemplateDef = var_Items
		Template = [var_Items.CellImages(AddItem("Item 3"),0) = "2,"]
	endwith
oG2antt.EndUpdate()
|
|
2039
|
How can I get the icon from the cell when using the Items.CellImages property (icon position within the cell)
/*
with (this.EXG2ANTTCHARTACTIVEXCONTROL1.nativeObject)
	MouseMove = class::nativeObject_MouseMove
endwith
*/
// Occurs when the user moves the mouse.
function nativeObject_MouseMove(Button, Shift, X, Y)
	local i
	oG2antt = form.EXG2ANTTCHARTACTIVEXCONTROL1.nativeObject
	i = oG2antt.ItemFromPoint(-1,-1,c,hit)
	? Str(oG2antt.FormatABC("( 0x44 = ( value bitand 0x44 ) ) ? 1 + ( (value bitand 0xFFFF0000) bitshift 16 ) : `no image`",hit))
return

local oG2antt,var_Chart,var_Items

oG2antt = form.EXG2ANTTCHARTACTIVEXCONTROL1.nativeObject
oG2antt.BeginUpdate()
oG2antt.Images("gBJJgBAIDAAGAAEAAQhYAf8Pf4hh0QihCJo2AEZjQAjEZFEaIEaEEaAIAkcbk0olUrlktl0vmExmUzmk1m03nE5nU7nk9n0/oFBoVDolFo1HpFJpVLplNp1PqFRqVTqlVq1XrFZrVbrldr1fsFhsVjslls1ntFptVrtltt1vuFxuVzul1u13vF5vV7vl9v1/wGBwWDwmFw2HxGJxWLxmNx0xiFdyOTh8Tf9ZymXx+QytcyNgz8r0OblWjyWds+m0ka1Vf1ta1+r1mos2xrG2xeZ0+a0W0qOx3GO4NV3WeyvD2XJ5XL5nN51aiw+lfSj0gkUkAEllHanHI5j/cHg8EZf7w8vl8j4f/qfEZeB09/vjLAB30+kZQAP/P5/H6/yNAOAEAwCjMBwFAEDwJBMDwLBYAP2/8Hv8/gAGAD8LQs9w/nhDY/oygIA=")
// oG2antt.Chart.PaneWidth(true) = 0
var_Chart = oG2antt.Chart
with (oG2antt)
	TemplateDef = [dim var_Chart]
	TemplateDef = var_Chart
	Template = [var_Chart.PaneWidth(True) = 0]
endwith
oG2antt.Columns.Add("Default")
var_Items = oG2antt.Items
	// var_Items.CellImages(var_Items.AddItem("Item 1"),0) = "3,2,1"
	with (oG2antt)
		TemplateDef = [dim var_Items]
		TemplateDef = var_Items
		Template = [var_Items.CellImages(AddItem("Item 1"),0) = "3,2,1"]
	endwith
	// var_Items.CellImages(var_Items.AddItem("Item 2"),0) = "2,3"
	with (oG2antt)
		TemplateDef = [dim var_Items]
		TemplateDef = var_Items
		Template = [var_Items.CellImages(AddItem("Item 2"),0) = "2,3"]
	endwith
	// var_Items.CellImages(var_Items.AddItem("Item 3"),0) = "2"
	with (oG2antt)
		TemplateDef = [dim var_Items]
		TemplateDef = var_Items
		Template = [var_Items.CellImages(AddItem("Item 3"),0) = "2"]
	endwith
oG2antt.EndUpdate()
|
|
2038
|
I have an EBN bar. Now if I apply an additional color to the bar, e,g, yellow, the bar is displayed as "dark yellow", which I assume is due to the black EBN color. How can I get the more "bright yellow" color
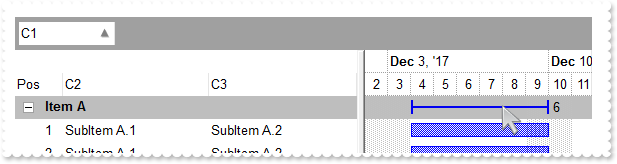
/*
with (this.EXG2ANTTCHARTACTIVEXCONTROL1.nativeObject)
	AddGroupItem = class::nativeObject_AddGroupItem
endwith
*/
// Occurs after a new Group Item has been inserted to Items collection.
function nativeObject_AddGroupItem(Item)
	local l,var_Chart,var_Items
	oG2antt = form.EXG2ANTTCHARTACTIVEXCONTROL1.nativeObject
	var_Items = oG2antt.Items
		// var_Items.ItemDividerLine(Item) = 0
		with (oG2antt)
			TemplateDef = [dim var_Items,Item]
			TemplateDef = var_Items
			TemplateDef = Item
			Template = [var_Items.ItemDividerLine(Item) = 0]
		endwith
		var_Items.AddBar(Item,"Summary","12/02/2017","12/02/2017")
		var_Items.DefineSummaryBars(Item,"",-3,"")
		l = var_Items.GroupItem(Item)
		// var_Items.CellSingleLine(Item,l) = false
		with (oG2antt)
			TemplateDef = [dim var_Items,Item,l]
			TemplateDef = var_Items
			TemplateDef = Item
			TemplateDef = l
			Template = [var_Items.CellSingleLine(Item,l) = False]
		endwith
		// var_Items.CellBold(Item,l) = true
		with (oG2antt)
			TemplateDef = [dim var_Items,Item,l]
			TemplateDef = var_Items
			TemplateDef = Item
			TemplateDef = l
			Template = [var_Items.CellBold(Item,l) = True]
		endwith
		// var_Items.ItemBackColor(Item) = 0xbebebe
		with (oG2antt)
			TemplateDef = [dim var_Items,Item]
			TemplateDef = var_Items
			TemplateDef = Item
			Template = [var_Items.ItemBackColor(Item) = 12500670]
		endwith
	// oG2antt.Chart.ItemBackColor(Item) = 0xbebebe
	var_Chart = oG2antt.Chart
	with (oG2antt)
		TemplateDef = [dim var_Chart]
		TemplateDef = var_Chart
		Template = [var_Chart.ItemBackColor(Item) = 12500670]
	endwith
return

/*
with (this.EXG2ANTTCHARTACTIVEXCONTROL1.nativeObject)
	AddItem = class::nativeObject_AddItem
endwith
*/
// Occurs after a new Item has been inserted to Items collection.
function nativeObject_AddItem(Item)
	oG2antt = form.EXG2ANTTCHARTACTIVEXCONTROL1.nativeObject
	oG2antt.Items.AddBar(Item,"Task","12/04/2017","12/10/2017")
return

local h,oG2antt,var_Appearance,var_Bar,var_Chart,var_Column,var_Column1,var_Columns,var_Items

oG2antt = form.EXG2ANTTCHARTACTIVEXCONTROL1.nativeObject
oG2antt.BeginUpdate()
var_Appearance = oG2antt.VisualAppearance
	var_Appearance.Add(1,"gBFLBCJwBAEHhEJAAEhABOUGACAADACAxRDgMQBQKAAzAJBIYhiG4cYCgMZhXDOCYXABCEYRXBIZQ7BKNIxjSJwFgmEgADCMQwAFBIbhrE4ZBjHGQRUgyI43RhHUBzVIUBxDEaTZLlEYJBgeHYhDJPcaUVDcWQHGyeZwjSgpKoWSJIU5NcggPDgEwTKCmKlTAKoSzJMyEmwWRAdVTZLSEaxierKPhyWT/XgAF4PfDFKRXFqXY5mKZJFqKOI8TxINgxPQMGyrBqraLqKwQGrGCQKSBhUZ3dS2JR3OSlYRuQAMVgOXoDZhPWZXbDtSzPE63NgtOR5DiGWalABoeoxRa9cz3ViCJSrGTqIoINIzZLHFQbPpdAYdP6BeIjXhhZxBBuLZXmEOh9CcNoni2N4MjWVodh+DpfBeLJinsWR9AyYwVAkGBhEAFphGiRogDEGBamkFgtjcZgHiMbgehYaQhAIEIREAaQYkcQZUHIGRUGQDBOEaBAhDYDxGkMZAkCgeoagYZAYEYAYIAWGhemICIFj8WIiCiFR5gkIhogmBoKGKJx2C6C5hniMgggqYwog0UoNGMZJiDiCZRgOLY0ECUAQICA==")
	var_Appearance.RenderType = -268435456
var_Chart = oG2antt.Chart
	var_Chart.LevelCount = 2
	var_Chart.FirstVisibleDate = "12/02/2017"
	// var_Chart.PaneWidth(false) = 342
	with (oG2antt)
		TemplateDef = [dim var_Chart]
		TemplateDef = var_Chart
		Template = [var_Chart.PaneWidth(False) = 342]
	endwith
	var_Bar = var_Chart.Bars.Item("Summary")
		var_Bar.StartShape = 0
		var_Bar.EndShape = 0
		var_Bar.Shape = 1
		var_Bar.Color = 0x1ff0000
		// var_Bar.Def(3) = "<%=%513%>"
		with (oG2antt)
			TemplateDef = [dim var_Bar]
			TemplateDef = var_Bar
			Template = [var_Bar.Def(3) = "<%=%513%>"]
		endwith
		// var_Bar.Def(4) = 18
		with (oG2antt)
			TemplateDef = [dim var_Bar]
			TemplateDef = var_Bar
			Template = [var_Bar.Def(4) = 18]
		endwith
var_Columns = oG2antt.Columns
	var_Columns.Add("C1")
	var_Columns.Add("C2")
	var_Columns.Add("C3")
	var_Column = var_Columns.Add("Pos")
		var_Column.FormatColumn = "1 pos ``"
		var_Column.AllowGroupBy = false
		var_Column.Position = 0
		var_Column.Width = 48
		var_Column.AllowSizing = false
oG2antt.SortBarVisible = true
oG2antt.SortBarCaption = "Drag a <b>column</b> header here to group by that column."
oG2antt.AllowGroupBy = true
oG2antt.HasLines = 0
oG2antt.LinesAtRoot = 0
var_Items = oG2antt.Items
	h = var_Items.AddItem("Item A")
	// var_Items.CellValue(h,1) = "SubItem A.1"
	with (oG2antt)
		TemplateDef = [dim var_Items,h]
		TemplateDef = var_Items
		TemplateDef = h
		Template = [var_Items.CellValue(h,1) = "SubItem A.1"]
	endwith
	// var_Items.CellValue(h,2) = "SubItem A.2"
	with (oG2antt)
		TemplateDef = [dim var_Items,h]
		TemplateDef = var_Items
		TemplateDef = h
		Template = [var_Items.CellValue(h,2) = "SubItem A.2"]
	endwith
	h = var_Items.AddItem("Item A")
	// var_Items.CellValue(h,1) = "SubItem A.1"
	with (oG2antt)
		TemplateDef = [dim var_Items,h]
		TemplateDef = var_Items
		TemplateDef = h
		Template = [var_Items.CellValue(h,1) = "SubItem A.1"]
	endwith
	// var_Items.CellValue(h,2) = "SubItem A.2"
	with (oG2antt)
		TemplateDef = [dim var_Items,h]
		TemplateDef = var_Items
		TemplateDef = h
		Template = [var_Items.CellValue(h,2) = "SubItem A.2"]
	endwith
	h = var_Items.AddItem("Item B")
	// var_Items.CellValue(h,1) = "SubItem B.1"
	with (oG2antt)
		TemplateDef = [dim var_Items,h]
		TemplateDef = var_Items
		TemplateDef = h
		Template = [var_Items.CellValue(h,1) = "SubItem B.1"]
	endwith
	// var_Items.CellValue(h,2) = "SubItem B.2"
	with (oG2antt)
		TemplateDef = [dim var_Items,h]
		TemplateDef = var_Items
		TemplateDef = h
		Template = [var_Items.CellValue(h,2) = "SubItem B.2"]
	endwith
	h = var_Items.AddItem("Item B")
	// var_Items.CellValue(h,1) = "SubItem B.1"
	with (oG2antt)
		TemplateDef = [dim var_Items,h]
		TemplateDef = var_Items
		TemplateDef = h
		Template = [var_Items.CellValue(h,1) = "SubItem B.1"]
	endwith
	// var_Items.CellValue(h,2) = "SubItem B.2"
	with (oG2antt)
		TemplateDef = [dim var_Items,h]
		TemplateDef = var_Items
		TemplateDef = h
		Template = [var_Items.CellValue(h,2) = "SubItem B.2"]
	endwith
var_Column1 = oG2antt.Columns.Item(0)
	var_Column1.SortOrder = 1
oG2antt.EndUpdate()
|
|
2037
|
Is it possible to change the visual appearance of the position signs when user changes the column's position by drag and drop
local oG2antt,var_Appearance,var_Columns

oG2antt = form.EXG2ANTTCHARTACTIVEXCONTROL1.nativeObject
oG2antt.BeginUpdate()
oG2antt.HeaderAppearance = 4
var_Columns = oG2antt.Columns
	var_Columns.Add("Column 1")
	var_Columns.Add("Column 2")
	var_Columns.Add("Column 3")
var_Appearance = oG2antt.VisualAppearance
	var_Appearance.Add(1,"gBFLBCJwBAEHhEJAAEhABZEGACAADACAxRDgMQBQKAAzAJBIYhiG4cYCgMYxXDOCYXABCEYRXBIZQ7BKNIxjSJwFgmEgADKMA4SOKIZhrE4bBhGaQRUgyI43RhHUBzVIUcQvE6TZRHCQYHgkNIhDJIM7TPLkeSVJaTIRoKhJUogApQThTMgVRDEThkGoSa6soSoYTDBKybLrSLKagOT5YUDKUqSdKEZRpEq1YztWbaQoCUoqVRRVIWfbNd4JJa4aDhWpYdpeeY5R7bWLgBYVVABL7LLRsSxpHxPF6RXxaeI3GKsaS8G6ic6nPQMHj7I4NS5pUa6Rh2VYNSa8AAtETRYznOw4bTMXAjNIea5bAYIIR5HIoDzVbQcCQAHL9DBeEMIQEEISgGhMGZQmocgymoYRRCIEQ0G2HYBnEIBig4V4zCQGINnmagCECY43medZ6H2Pw/g+X5fnueh/h+R5+AKABfkMWgGgGYA4AICoCGCE5WA4CphACMgSD2IRIDIBICmEd5YGCBpRjGBgegWIYIgWdgoGIRQsiKCZiAiJZ0gGQI4jUS4LECOAiBmDJflGfg2BSY4Al4OhGkOCJ2DgFJjGGfgqgiH5Ch4RhGkqOQmEOEpkFkHQYhJRYyESAokGKHhIhKIxJEmf4VGUeRGFmF5iBkchPhYJQ5GoYIZg6Ug6GoFYmkmNhuhulRGHKGoImefh0BUZ4JmYeoemeSZ2H6HQmgoBgXDqXwUAQgI=")
	var_Appearance.Add(2,"CP:1 0 -36 0 0")
oG2antt.Template = [Background(182) = 33554432] // oG2antt.Background(182) = 0x2000000
oG2antt.EndUpdate()
|
|
2036
|
Overlaid-Types
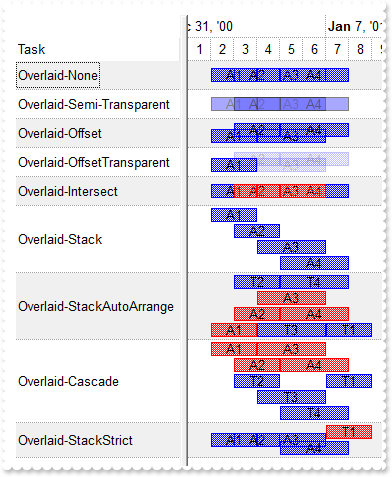
/*
with (this.EXG2ANTTCHARTACTIVEXCONTROL1.nativeObject)
	AddItem = class::nativeObject_AddItem
endwith
*/
// Occurs after a new Item has been inserted to Items collection.
function nativeObject_AddItem(Item)
	local barName,var_Items
	oG2antt = form.EXG2ANTTCHARTACTIVEXCONTROL1.nativeObject
	var_Items = oG2antt.Items
		barName = var_Items.ItemData(Item)
		var_Items.AddBar(Item,barName,"01/02/2001","01/04/2001","A1")
		var_Items.AddBar(Item,barName,"01/03/2001","01/05/2001","A2")
		var_Items.AddBar(Item,barName,"01/04/2001","01/07/2001","A3")
		var_Items.AddBar(Item,barName,"01/05/2001","01/08/2001","A4")
return

local h,oG2antt,var_Bar,var_Bar1,var_Bar2,var_Bar3,var_Bar4,var_Bar5,var_Bar6,var_Bar7,var_Bar8,var_Chart,var_Items

oG2antt = form.EXG2ANTTCHARTACTIVEXCONTROL1.nativeObject
oG2antt.BeginUpdate()
oG2antt.DefaultItemHeight = 22
oG2antt.Columns.Add("Task")
oG2antt.ScrollBySingleLine = true
oG2antt.BackColorAlternate = 0xf0f0f0
oG2antt.DrawGridLines = 1
var_Chart = oG2antt.Chart
	var_Chart.DrawGridLines = 1
	var_Chart.ShowNonworkingDates = false
	// var_Chart.PaneWidth(false) = 164
	with (oG2antt)
		TemplateDef = [dim var_Chart]
		TemplateDef = var_Chart
		Template = [var_Chart.PaneWidth(False) = 164]
	endwith
	var_Chart.FirstVisibleDate = "12/28/2000"
	var_Chart.LevelCount = 2
	// var_Chart.Bars.Copy("Task","Intersect").Color = 0xff
	var_Bar = var_Chart.Bars.Copy("Task","Intersect")
	with (oG2antt)
		TemplateDef = [dim var_Bar]
		TemplateDef = var_Bar
		Template = [var_Bar.Color = 255]
	endwith
	var_Chart.Bars.Item("Task").OverlaidType = 0
	var_Bar1 = var_Chart.Bars.Copy("Task","Task-Transparent")
		var_Bar1.OverlaidType = 0
		// var_Bar1.Def(19) = 50
		with (oG2antt)
			TemplateDef = [dim var_Bar1]
			TemplateDef = var_Bar1
			Template = [var_Bar1.Def(19) = 50]
		endwith
		var_Bar1.Pattern = 32
		var_Bar1.Color = 0x0
		var_Bar1.StartColor = 0xff5050
		var_Bar1.EndColor = var_Bar1.StartColor
	// var_Chart.Bars.Copy("Task","Task-Offset").OverlaidType = 1
	var_Bar2 = var_Chart.Bars.Copy("Task","Task-Offset")
	with (oG2antt)
		TemplateDef = [dim var_Bar2]
		TemplateDef = var_Bar2
		Template = [var_Bar2.OverlaidType = 1]
	endwith
	var_Bar3 = var_Chart.Bars.Copy("Task","Task-OffsetTransparent")
		var_Bar3.OverlaidType = 257 /*exOverlaidBarsTransparent | exOverlaidBarsOffset*/
		// var_Bar3.Overlaid(256) = 75
		with (oG2antt)
			TemplateDef = [dim var_Bar3]
			TemplateDef = var_Bar3
			Template = [var_Bar3.Overlaid(256) = 75]
		endwith
	var_Bar4 = var_Chart.Bars.Copy("Task","Task-Intersect")
		var_Bar4.OverlaidType = 2
		// var_Bar4.Overlaid(2) = "Intersect"
		with (oG2antt)
			TemplateDef = [dim var_Bar4]
			TemplateDef = var_Bar4
			Template = [var_Bar4.Overlaid(2) = "Intersect"]
		endwith
	// var_Chart.Bars.Copy("Task","Task-Stack").OverlaidType = 3
	var_Bar5 = var_Chart.Bars.Copy("Task","Task-Stack")
	with (oG2antt)
		TemplateDef = [dim var_Bar5]
		TemplateDef = var_Bar5
		Template = [var_Bar5.OverlaidType = 3]
	endwith
	var_Bar6 = var_Chart.Bars.Copy("Task","Task-StackAutoArrange")
		var_Bar6.OverlaidType = 515 /*exOverlaidBarsStackAutoArrange | exOverlaidBarsStack*/
		var_Bar6.Color = 0xff
		var_Bar6.OverlaidGroup = "Task"
	var_Bar7 = var_Chart.Bars.Copy("Task","Task-Cascade")
		var_Bar7.OverlaidType = 4
		var_Bar7.Color = 0xff
		var_Bar7.OverlaidGroup = "Task"
	var_Bar8 = var_Chart.Bars.Copy("Task","Task-Strict")
		var_Bar8.OverlaidType = 8195 /*exOverlaidBarsStrict | exOverlaidBarsStack*/
		var_Bar8.OverlaidGroup = "Task"
		var_Bar8.Color = 0xff
var_Items = oG2antt.Items
	var_Items.InsertItem(0,"Task","Overlaid-None")
	var_Items.InsertItem(0,"Task-Transparent","Overlaid-Semi-Transparent")
	var_Items.InsertItem(0,"Task-Offset","Overlaid-Offset")
	var_Items.InsertItem(0,"Task-OffsetTransparent","Overlaid-OffsetTransparent")
	var_Items.InsertItem(0,"Task-Intersect","Overlaid-Intersect")
	var_Items.InsertItem(0,"Task-Stack","Overlaid-Stack")
	h = var_Items.InsertItem(0,"Task-StackAutoArrange","Overlaid-StackAutoArrange")
	var_Items.AddBar(h,"Task","01/07/2001","01/09/2001","T1")
	var_Items.AddBar(h,"Task","01/03/2001","01/05/2001","T2")
	var_Items.AddBar(h,"Task","01/04/2001","01/07/2001","T3")
	var_Items.AddBar(h,"Task","01/05/2001","01/08/2001","T4")
	h = var_Items.InsertItem(0,"Task-Cascade","Overlaid-Cascade")
	var_Items.AddBar(h,"Task","01/07/2001","01/09/2001","T1")
	var_Items.AddBar(h,"Task","01/03/2001","01/05/2001","T2")
	var_Items.AddBar(h,"Task","01/04/2001","01/07/2001","T3")
	var_Items.AddBar(h,"Task","01/05/2001","01/08/2001","T4")
	// var_Items.ItemBar(h,"<A*>",52) = "A"
	with (oG2antt)
		TemplateDef = [dim var_Items,h]
		TemplateDef = var_Items
		TemplateDef = h
		Template = [var_Items.ItemBar(h,"<A*>",52) = "A"]
	endwith
	// var_Items.ItemBar(h,"<T*>",52) = "T"
	with (oG2antt)
		TemplateDef = [dim var_Items,h]
		TemplateDef = var_Items
		TemplateDef = h
		Template = [var_Items.ItemBar(h,"<T*>",52) = "T"]
	endwith
	h = var_Items.InsertItem(0,"Task","Overlaid-StackStrict")
	var_Items.AddBar(h,"Task-Strict","01/07/2001","01/09/2001","T1")
	// var_Items.ItemBar(0,"<*>",3) = "<%=%9%>"
	with (oG2antt)
		TemplateDef = [dim var_Items]
		TemplateDef = var_Items
		Template = [var_Items.ItemBar(0,"<*>",3) = "<%=%9%>"]
	endwith
oG2antt.EndUpdate()
|
|
2035
|
FilterBarCaption ALLUI Keyword ( sample 3, result, leaf )
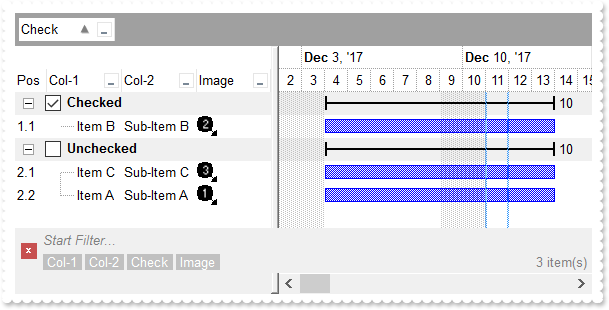
/*
with (this.EXG2ANTTCHARTACTIVEXCONTROL1.nativeObject)
	AddGroupItem = class::nativeObject_AddGroupItem
endwith
*/
// Occurs after a new Group Item has been inserted to Items collection.
function nativeObject_AddGroupItem(Item)
	local l,val,var_Chart,var_Items,var_Items1
	oG2antt = form.EXG2ANTTCHARTACTIVEXCONTROL1.nativeObject
	var_Items = oG2antt.Items
		// var_Items.ItemBackColor(Item) = 0xf0f0f0
		with (oG2antt)
			TemplateDef = [dim var_Items,Item]
			TemplateDef = var_Items
			TemplateDef = Item
			Template = [var_Items.ItemBackColor(Item) = 15790320]
		endwith
		val = var_Items.CellValue(Item,var_Items.GroupItem(Item))
		// var_Items.CellState(Item,var_Items.GroupItem(Item)) = oG2antt.FormatABC("A = `Checked` ? 1 : 0",val)
		with (oG2antt)
			TemplateDef = [dim var_Items,Item]
			TemplateDef = var_Items
			TemplateDef = Item
			Template = [var_Items.CellState(Item,GroupItem(Item)) = Me.FormatABC("A = `Checked` ? 1 : 0",val)]
		endwith
	var_Items1 = oG2antt.Items
		// var_Items1.ItemDividerLine(Item) = 0
		with (oG2antt)
			TemplateDef = [dim var_Items1,Item]
			TemplateDef = var_Items1
			TemplateDef = Item
			Template = [var_Items1.ItemDividerLine(Item) = 0]
		endwith
		var_Items1.AddBar(Item,"Summary","12/02/2017","12/02/2017")
		var_Items1.DefineSummaryBars(Item,"",-3,"")
		l = var_Items1.GroupItem(Item)
		// var_Items1.CellSingleLine(Item,l) = false
		with (oG2antt)
			TemplateDef = [dim var_Items1,Item,l]
			TemplateDef = var_Items1
			TemplateDef = Item
			TemplateDef = l
			Template = [var_Items1.CellSingleLine(Item,l) = False]
		endwith
		// var_Items1.CellBold(Item,l) = true
		with (oG2antt)
			TemplateDef = [dim var_Items1,Item,l]
			TemplateDef = var_Items1
			TemplateDef = Item
			TemplateDef = l
			Template = [var_Items1.CellBold(Item,l) = True]
		endwith
	// oG2antt.Chart.ItemBackColor(Item) = 0xf0f0f0
	var_Chart = oG2antt.Chart
	with (oG2antt)
		TemplateDef = [dim var_Chart]
		TemplateDef = var_Chart
		Template = [var_Chart.ItemBackColor(Item) = 15790320]
	endwith
return

/*
with (this.EXG2ANTTCHARTACTIVEXCONTROL1.nativeObject)
	AddItem = class::nativeObject_AddItem
endwith
*/
// Occurs after a new Item has been inserted to Items collection.
function nativeObject_AddItem(Item)
	local i,var_Items
	oG2antt = form.EXG2ANTTCHARTACTIVEXCONTROL1.nativeObject
	i = oG2antt.FormatABC("value + 1",oG2antt.Items.ItemToIndex(Item))
	// oG2antt.Items.CellImage(Item,3) = i
	var_Items = oG2antt.Items
	with (oG2antt)
		TemplateDef = [dim var_Items]
		TemplateDef = var_Items
		Template = [var_Items.CellImage(Item,3) = i]
	endwith
	oG2antt.Items.AddBar(Item,"Task","12/04/2017","12/14/2017")
return

local h,oG2antt,var_Bar,var_Chart,var_Column,var_Column1,var_Column2,var_Column3,var_Column4,var_Column5,var_Items

oG2antt = form.EXG2ANTTCHARTACTIVEXCONTROL1.nativeObject
oG2antt.BeginUpdate()
oG2antt.VisualAppearance.Add(1,"gBFLBCJwBAEHhEJAAEhABOUGACAADACAxRDgMQBQKAAzAJBIYhiG4cYCgMZhXDOCYXABCEYRXBIZQ7BKNIxjSJwFgmEgADCMQwAFBIbhrE4ZBjHGQRUgyI43RhHUBzVIUBxDEaTZLlEYJBgeHYhDJPcaUVDcWQHGyeZwjSgpKoWSJIU5NcggPDgEwTKCmKlTAKoSzJMyEmwWRAdVTZLSEaxierKPhyWT/XgAF4PfDFKRXFqXY5mKZJFqKOI8TxINgxPQMGyrBqraLqKwQGrGCQKSBhUZ3dS2JR3OSlYRuQAMVgOXoDZhPWZXbDtSzPE63NgtOR5DiGWalABoeoxRa9cz3ViCJSrGTqIoINIzZLHFQbPpdAYdP6BeIjXhhZxBBuLZXmEOh9CcNoni2N4MjWVodh+DpfBeLJinsWR9AyYwVAkGBhEAFphGiRogDEGBamkFgtjcZgHiMbgehYaQhAIEIREAaQYkcQZUHIGRUGQDBOEaBAhDYDxGkMZAkCgeoagYZAYEYAYIAWGhemICIFj8WIiCiFR5gkIhogmBoKGKJx2C6C5hniMgggqYwog0UoNGMZJiDiCZRgOLY0ECUAQICA==")
var_Chart = oG2antt.Chart
	var_Chart.LevelCount = 2
	var_Chart.FirstVisibleDate = "12/02/2017"
	// var_Chart.PaneWidth(false) = 256
	with (oG2antt)
		TemplateDef = [dim var_Chart]
		TemplateDef = var_Chart
		Template = [var_Chart.PaneWidth(False) = 256]
	endwith
	var_Bar = var_Chart.Bars.Item("Summary")
		var_Bar.StartShape = 0
		var_Bar.EndShape = 0
		var_Bar.Shape = 1
		var_Bar.Color = 0x1000000
		// var_Bar.Def(3) = "<%=%513%>"
		with (oG2antt)
			TemplateDef = [dim var_Bar]
			TemplateDef = var_Bar
			Template = [var_Bar.Def(3) = "<%=%513%>"]
		endwith
		// var_Bar.Def(4) = 18
		with (oG2antt)
			TemplateDef = [dim var_Bar]
			TemplateDef = var_Bar
			Template = [var_Bar.Def(4) = 18]
		endwith
oG2antt.Images("gBJJgBAIDAAGAAEAAQhYAf8Pf4hh0QihCJo2AEZjQAjEZFEaIEaEEaAIAkcbk0olUrlktl0vmExmUzmk1m03nE5nU7nk9n0/oFBoVDolFo1HpFJpVLplNp1PqFRqVTqlVq1XrFZrVbrldr1fsFhsVjslls1ntFptVrtltt1vuFxuVzul1u13vF5vV7vl9v1/wGBwWDwmFw2HxGJxWLxmNx0xiFdyOTh8Tf9ZymXx+QytcyNgz8r0OblWjyWds+m0ka1Vf1ta1+r1mos2xrG2xeZ0+a0W0qOx3GO4NV3WeyvD2XJ5XL5nN51aiw+lfSj0gkUkAEllHanHI5j/cHg8EZf7w8vl8j4f/qfEZeB09/vjLAB30+kZQAP/P5/H6/yNAOAEAwCjMBwFAEDwJBMDwLBYAP2/8Hv8/gAGAD8LQs9w/nhDY/oygIA=")
var_Column = oG2antt.Columns.Add("Col-1")
	var_Column.DisplayFilterButton = true
	var_Column.FilterList = 9504 /*exShowExclude | exShowFocusItem | exShowCheckBox | exSortItemsAsc*/
var_Column1 = oG2antt.Columns.Add("Col-2")
	var_Column1.DisplayFilterButton = true
	var_Column1.FilterList = 9504 /*exShowExclude | exShowFocusItem | exShowCheckBox | exSortItemsAsc*/
var_Column2 = oG2antt.Columns.Add("Check")
	// var_Column2.Def(0) = true
	with (oG2antt)
		TemplateDef = [dim var_Column2]
		TemplateDef = var_Column2
		Template = [var_Column2.Def(0) = True]
	endwith
	var_Column2.DisplayFilterButton = true
	var_Column2.DisplayFilterPattern = false
	var_Column2.FilterType = 6
var_Column3 = oG2antt.Columns.Add("Image")
	var_Column3.DisplayFilterButton = true
	var_Column3.FilterType = 10
	var_Column3.FilterList = 9472 /*exShowExclude | exShowFocusItem | exShowCheckBox*/
var_Column4 = oG2antt.Columns.Add("Pos")
	var_Column4.AllowSizing = false
	var_Column4.AllowSort = false
	var_Column4.Width = 32
	var_Column4.FormatColumn = "1 rpos ``"
	var_Column4.Position = 0
var_Items = oG2antt.Items
	// var_Items.CellValue(var_Items.AddItem("Item A"),1) = "Sub-Item A"
	with (oG2antt)
		TemplateDef = [dim var_Items]
		TemplateDef = var_Items
		Template = [var_Items.CellValue(AddItem("Item A"),1) = "Sub-Item A"]
	endwith
	h = var_Items.AddItem("Item B")
	// var_Items.CellValue(h,1) = "Sub-Item B"
	with (oG2antt)
		TemplateDef = [dim var_Items,h]
		TemplateDef = var_Items
		TemplateDef = h
		Template = [var_Items.CellValue(h,1) = "Sub-Item B"]
	endwith
	// var_Items.CellState(h,2) = 1
	with (oG2antt)
		TemplateDef = [dim var_Items,h]
		TemplateDef = var_Items
		TemplateDef = h
		Template = [var_Items.CellState(h,2) = 1]
	endwith
	// var_Items.CellValue(var_Items.AddItem("Item C"),1) = "Sub-Item C"
	with (oG2antt)
		TemplateDef = [dim var_Items]
		TemplateDef = var_Items
		Template = [var_Items.CellValue(AddItem("Item C"),1) = "Sub-Item C"]
	endwith
oG2antt.FilterBarFont = oG2antt.Font
oG2antt.Template = [Description(11) = FormatABC("`<fgcolor=808080> ` + value + ` </fgcolor>`",Description(11))] // oG2antt.Description(11) = Str(oG2antt.FormatABC("`<fgcolor=808080> ` + value + ` </fgcolor>`",oG2antt.Description(11)))
oG2antt.FilterBarCaption = "(( ( allui replace `[<b>` with `<bgcolor=000000><fgcolor=FFFFFF><b> ` replace `</b>]` with ` </b></bgcolor></fgcolor>` replace `[<s>` with `<bgcolor=C0C0C0><fgcolor=FFFFFF> ` replace `</s>]` with ` </fgcolor></bgcolor>` )  + `<r><fgcolor=808080>` + ( matchitemcount < 0 ? ( ( len(value) ? `` : `` ) + `<r>` + leafitemcount + ` result(s)` ) : (`<r><fgcolor=808080>`+ leafitemcount + ` item(s)`) )))"
oG2antt.FilterBarPromptVisible = 3 /*exFilterBarVisible | exFilterBarPromptVisible*/
oG2antt.AllowGroupBy = true
oG2antt.SortBarVisible = true
var_Column5 = oG2antt.Columns.Item(2)
	var_Column5.FormatColumn = "%CS2 ? `Checked` : `Unchecked`"
	var_Column5.SortOrder = 1
oG2antt.EndUpdate()
|
|
2034
|
A black portion is shown while I am using the BackColorAlternate with EBN colors. What can I do
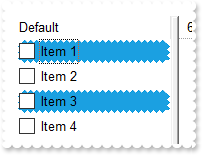
local oG2antt,var_Column,var_Column1,var_ConditionalFormat,var_Items

oG2antt = form.EXG2ANTTCHARTACTIVEXCONTROL1.nativeObject
oG2antt.BeginUpdate()
oG2antt.ColumnAutoResize = true
oG2antt.DefaultItemHeight = 20
oG2antt.VisualAppearance.Add(1,"gBFLBCJwBAEHhEJAAEhIDhAxHAxg0HG0Mg4xGI3HMOig3GcJiYAf8jAEhhUnAAyhEqg8hk0oAsIjgAiAwmYxGA4mYzGwwkI0i0ooUnB0IBMIl1Dg8zmYyGolptPkI1mY1GAll9KoUslNIrVCqNQldShFUstXAVfrVcrlZtVhuFnsUHq1zoczoQGhFBkNpg6zbDykUkhsPHE2h85nc9n8xtVDtlex9Msd2p1YstVq9ux8HyMtzuFz1PsNTzQlv2hhWfkuqpeVuN0q+nvEooN5veSAGpkb/ACcZrvhU3w83nM/poxGuchGpoVBvWgg+8knA4WimnFxI45Er5XOlHMg/Q3XU33W4ew9Wyu11mchDagcO7zus8VDoNBBEIKBpMY6DqOQyokhA/IQIQmwMk4bIQFDcoO6LWgwhQkNcABwEyAB5GwWbet6cRQg3DENQ5D8QxADZvEkAB8nabsURGeBpFM3pwE2AEZRpDx/neZpOR3Dz9oO/r/wCMoZNTBQAQRJSEwYg8HPGhEIoNCaEwq10gQ2WcRt7LcRxRFpuxUAEURQ3sczBEMgTTG8gN7HpOSEAEiQBAQZpmQ0DibPUFwbKcHwkhQoQtNQNzNEMbABOKDy/DMYQzHLeoPL0OTJSUd0pHcxTewk5zrIygIRPslz4lEngBKIAQivgASs/kLSBTlO00f8t0vGcgUbDlDRjXLCUNRERRvRgAHW2oAICA==")
var_Column = oG2antt.Columns.Add("Default")
	// var_Column.Def(0) = true
	with (oG2antt)
		TemplateDef = [dim var_Column]
		TemplateDef = var_Column
		Template = [var_Column.Def(0) = True]
	endwith
	var_Column.PartialCheck = true
var_Column1 = oG2antt.Columns.Add("Position")
	var_Column1.FormatColumn = "1 rindex ``"
	var_Column1.Visible = false
var_ConditionalFormat = oG2antt.ConditionalFormats.Add("%C1 mod 2")
	var_ConditionalFormat.BackColor = 0x1000000
var_Items = oG2antt.Items
	var_Items.AddItem("Item 1")
	var_Items.AddItem("Item 2")
	var_Items.AddItem("Item 3")
	var_Items.AddItem("Item 4")
oG2antt.EndUpdate()
|
|
2033
|
How can I specify alternate background colors for each root item, similar with BackColorAlternate
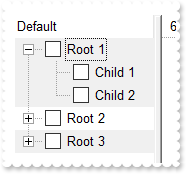
local h,oG2antt,var_Column,var_Column1,var_ConditionalFormat,var_Items

oG2antt = form.EXG2ANTTCHARTACTIVEXCONTROL1.nativeObject
oG2antt.BeginUpdate()
oG2antt.LinesAtRoot = -1
var_Column = oG2antt.Columns.Add("Default")
	// var_Column.Def(0) = true
	with (oG2antt)
		TemplateDef = [dim var_Column]
		TemplateDef = var_Column
		Template = [var_Column.Def(0) = True]
	endwith
	var_Column.PartialCheck = true
var_Column1 = oG2antt.Columns.Add("Position")
	var_Column1.FormatColumn = "( ( 1:=( ( 0:=(1 rpos '') ) lfind `.`) ) < 0 ? =:0 : (=:0 left =:1) )"
	var_Column1.Visible = false
var_ConditionalFormat = oG2antt.ConditionalFormats.Add("%C1 mod 2")
	var_ConditionalFormat.BackColor = 0xf0f0f0
var_Items = oG2antt.Items
	h = var_Items.AddItem("Root 1")
	var_Items.InsertItem(h,null,"Child 1")
	var_Items.InsertItem(h,null,"Child 2")
	// var_Items.ExpandItem(h) = true
	with (oG2antt)
		TemplateDef = [dim var_Items,h]
		TemplateDef = var_Items
		TemplateDef = h
		Template = [var_Items.ExpandItem(h) = True]
	endwith
	h = var_Items.AddItem("Root 2")
	var_Items.InsertItem(h,null,"Child 1")
	var_Items.InsertItem(h,null,"Child 2")
	h = var_Items.AddItem("Root 3")
	var_Items.InsertItem(h,null,"Child 1")
	var_Items.InsertItem(h,null,"Child 2")
oG2antt.EndUpdate()
|
|
2032
|
How can I change the visual appearance of the +/- buttons, open/close glyphs as current visual theme (method 4)
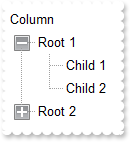
local h,oG2antt,var_Items

oG2antt = form.EXG2ANTTCHARTACTIVEXCONTROL1.nativeObject
oG2antt.BeginUpdate()
oG2antt.LinesAtRoot = -1
oG2antt.VisualDesign = "gBFLBWIgBAEHhEJAEGg6VAkHeLpgwChAOhULB8XAUUg8MAAREEHGMcgRCJ0ei8dhABDEcQAAYAQGKIYBkAKBQAGaAoDDMOQwQwAAxjGKEEwsACEIrjKCRShyCYZRhGcTSBCIZBqEqSZLiEZRQiiCYsS5GQBRWAkEwiBiEQTjea5CgOIAFS7LIqjRQEBxhIaZYIGaiQADENo9TxIMZAfBIHShK6NJABCCSQKkYx0HScRijDIEFwGIQmbKiej4DCiCQQW7OYYRVCNMQSfa8HivJyrcamfp/YBgOBYHb1eLVPR5LwfPCGUw1P6PLxkORZHimK4tSLHV7xVpMIwZFafIQhCCoHomS5NU7UNR0TQUFx9FaGX7rDDsGwLAJ6XRgF4bg2VpnHePpenAN4bH2GwHFmApSjEGBLnWOpRGOTBZHOegrE6BxPiWVJqCweQrn0LgJAWJBjwgaw1gKO5HmWch5h+fovF+G5bmich4BgfZkB8dynRUVYqiUR5rnmex/F6N4tn2AJfnebZ3DEXw3HWXgzAyIwgicKJKBKEIhCeCgiHyHYFEmSAFmqBghFIdgSCeIJygYDAyAgJx6AoIINAMOJNCgCZCGoGoLmMCI+CwJoihMNglCCIhzFCUg0EmMhghWDBkAiQg9CUY4jEYN4Jk2IxklYJoJHIUg+CSZJSESFwkkkGI+FOFIJEIRhPhMCRJCSVoRrSBhiDgTZjHYT4PEkYhwhgJYm0SaIaiaSYuE+GQNlmCIBGCJxjhiZQ5AkM" ;
	 +"hAg6ExJCkPhPguaAiFYUAlAkKZ0g6HoOEmWR/GHcA4m0OwIlIJIHCRgQshGJhpjoaocieaZiC6GAimkUgehIOwnGYGYIGkah6jaE4rg6SpCjKK5rEOMYlGIGIihKOggloFoqj6L5aGaBo6CkGIkAQjiPpCAAaJILCTJQlKPACDaXJgmSaJsnCdJ4nygKEoijKQpSmKcqCpKoqysK0rivLAsSyLMtC1LYty4Lkui7LwvS+L8wDBMIwzEMUxjHMgyTKMszDNM4zzQNE0jTNQ1TWNc2DZNo2zcN03jfOA4TiOM5DlOY5zoOk6jrOw7TuO88DxPI8z0PU9j3Pg+T6Ps/D9P4/0AQFAkDQRBUGQdCEJQpC0MQ1DkPRBEUSRNFEVBhFkXRhGQ9D6Dxfh+W5gGGd4QH2XQjCmDpFFaKoVB+D5Xmed5+H8YAHnIAh9EwV5Fl0d4MkMKJICmSgygSJAoEmMUCIPgnDCCIOQFYCxJjwFoCcA4kxoF+AIJkAgExegDEgEYQInAzCUAIOEGgfxiiRDYF1Q4EQ2BSCaEQYwbAiKREMpRSymFNDIAkAxT6oVRgSA2qdVKq1WqvVirMZQUhSCnBUMoIgoQRgnGSIQUgkg1hIHYAkAYMROAmHiLsE4xxSCxBwEwCQ0wmDdBsE0GYXBtg2CSPMFIuwYiQBYBQeAcwOCnBCCZgw0g0glBONAQgqQThCGgPQGoBQfiRGmOEZIPAXjsBoPAO4HRThhA0EQSA5BAgaCKJIGg3QdhOCmNU" &
	 +"BoQAijTCIF0FwQxpCHDIPAYYMQGgtCmFcaQtRAjZCyFYSojQ2B2BoKwIYFApBXEIBsIQ1QsAWAWEwaA1xCgjAoIAQBAQ="
oG2antt.Columns.Add("Column")
var_Items = oG2antt.Items
	h = var_Items.AddItem("Root 1")
	var_Items.InsertItem(h,null,"Child 1")
	var_Items.InsertItem(h,null,"Child 2")
	// var_Items.ExpandItem(h) = true
	with (oG2antt)
		TemplateDef = [dim var_Items,h]
		TemplateDef = var_Items
		TemplateDef = h
		Template = [var_Items.ExpandItem(h) = True]
	endwith
	h = var_Items.AddItem("Root 2")
	var_Items.InsertItem(h,null,"Child")
oG2antt.EndUpdate()
|
|
2031
|
How can I change the visual appearance of the +/- buttons, open/close glyphs as current visual theme (method 3)
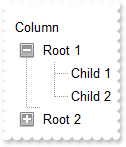
local h,oG2antt,var_Appearance,var_Items

oG2antt = form.EXG2ANTTCHARTACTIVEXCONTROL1.nativeObject
oG2antt.BeginUpdate()
var_Appearance = oG2antt.VisualAppearance
	var_Appearance.Add(3,"gBFLBCJwBAEHhEJAAEhABDwCg6AADACAxRDgMQBQKAAzAJBIYhiG4cYCgMZhXDOCYXABCEYRXBIZQ7BKNIxjSJ5BhIAAyDSJMjSRJUEhqGCWYDleYYYAKHIMQLJQKQSBcQR9EaBZBAWTpQC0OJDTJRI4TNAgbSYAAYRqoCb6loTKypaxjCQQIgkUBpGKdBynEYsDwSGyJCCJWyIbpKAwoVbcs4AYhuJpaQi+d5PFbjVT8dLAMBwLA8EwXAJ+OpfDxXU7eFKpR5fchXTI8UxXFqXZhkeQrfh7KYVRBKdBQRBEFQPJqnahqOpaXo2RoLUJKcQwHTmHYNQTALyuTALZrWeZ3XrgN74LbtZzVQauYRpbCMEr6bpoWLnFi6Ho1U4llWah1jqSweFqfxPgQQRphi+Yak0YIuqUfJegef4zluaJ3nqPJeCYH4BAeX5TDLBpVGqKRRnwf4flefZtHsX54BYAR/F+EwVnUd5eAMMJKDIChygyIQpAoEh4iIJ5JlgXIcgCXpIGoFwnGEQh6BEKBgmMIICHgIJCAiUAzgyUoAhwJohkiRgygwYpiGoKwzGIcgKCkNQNCMRIbCYCRYk4QoMiOchWDwNBjhiJJaDYTRiGiFwlCQAhOE8JBJHITIRgwZRZFCFCZBkOIUhKTRpCWAwgGYQ4El4NxlBifIWCcCYCFoaoMGaKYyG6GxlBmGJdhkCAWBIeA5g4U4QhMJAImkPIShRVxGgQJRlCIUISh+SJpnCZIeBgFgiHgO4OlOM" ;
	 +"INCISByECDQikkGhuh2JwpmqBogCKaYiC6FwhmkQ4yHgYgYiaHopiuaRakCbIsisSpGjYOwaHYKYMCkK5CA2IxrCwCwFigaJrkLTI6lcdANAEgIA=")
	var_Appearance.Add(1,"CP:3 -2 -2 2 2")
	var_Appearance.Add(4,"gBFLBCJwBAEHhEJAAEhABEICg6AADACAxRDgMQBQKAAzAJBIYhiG4cYCgMZhXDOCYXABCEYRXBIZQ7BKNIxjSJ5BhIAAyDSJMjSRJUEhqGCWYDleYYYAKHIMQLJQKQSBcQR9EaBZBAWTpQC0OJDTJRI4TNAgbSYAAYRqoCb6loTKypaxjCQQIgkUBpGKdBynEYsDwSGyJCCJWyIbpKAwoVbcs4AYhuJpaQi+d5PFbjVT8dLAMBwLA8EwXAJ+OpfDxXU7eFKpR5fchXTI8UxXFqXZhkeQrfh7KYVRBKdBQRBEFQPJqnahqOpaXo2RoLUJKcQwHTmHYNQTALyuTALZrWeZ3XrgN74LbtZzVQauYRpbCMEr6bpoWLnFi6Ho1U4llWah1jqSweFqfxPgQQRphi+Yak0YIuqUfJeg8X4rluaZ3niGB+AQHx/EyShjjEVYqiUR5rnmex/GAB5+AIf4gEeXJFHyXZ3gCTAygyAociMKBKEKBIeCiCZyHYFAnCEeBkh+BghFgRIegOCgYCySAgh4CAkgINAMmMNIgCcCYjn4LoLmMCJGDKC5ijIagoDMYhCAoJg1A0IxEhsJgJFiThChCY5yFYPA0GOGIYloNhNGIaIXCUJACE4TwkEkchOFSFYlFkXhUCUCQZEYTglCSMxaEkYJIBmFJhDeDZZEYPwlgmQhghaGqVDoa4bGaeY6FGGZNlmFIBGEJ4jhiZQ5AkMhAg6E5JCkRoGCUSQ6B6CYiSCBIOh+DhJmmARiWQO" ;
	 +"JtDsCJSCSBwkXSLIRicaZ6HqIIomoIguhwIpphIHoWDsJ4mCGChpmqOpGheLIOkqUo2iya4DjGJxihiQoSj4IJaDaMpCjCWoGg6PgpBiQ4tHcQJQBAgI=")
	var_Appearance.Add(2,"CP:4 -2 -2 2 2")
oG2antt.LinesAtRoot = 1
oG2antt.HasButtons = 4
oG2antt.Template = [HasButtonsCustom(0) = 16777216] // oG2antt.HasButtonsCustom(false) = 16777216
oG2antt.Template = [HasButtonsCustom(1) = 33554432] // oG2antt.HasButtonsCustom(true) = 33554432
oG2antt.Columns.Add("Column")
var_Items = oG2antt.Items
	h = var_Items.AddItem("Root 1")
	var_Items.InsertItem(h,null,"Child 1")
	var_Items.InsertItem(h,null,"Child 2")
	// var_Items.ExpandItem(h) = true
	with (oG2antt)
		TemplateDef = [dim var_Items,h]
		TemplateDef = var_Items
		TemplateDef = h
		Template = [var_Items.ExpandItem(h) = True]
	endwith
	h = var_Items.AddItem("Root 2")
	var_Items.InsertItem(h,null,"Child")
oG2antt.EndUpdate()
|
|
2030
|
How can I change the visual appearance of the +/- buttons, open/close glyphs as current visual theme (method 2)
local h,oG2antt,var_Appearance,var_Items

oG2antt = form.EXG2ANTTCHARTACTIVEXCONTROL1.nativeObject
oG2antt.BeginUpdate()
var_Appearance = oG2antt.VisualAppearance
	var_Appearance.Add(1,"XP:TREEVIEW 2 1")
	var_Appearance.Add(2,"XP:TREEVIEW 2 2")
oG2antt.Template = [Background(180) = 16777216] // oG2antt.Background(180) = 0x1000000
oG2antt.Template = [Background(181) = 33554432] // oG2antt.Background(181) = 0x2000000
oG2antt.LinesAtRoot = -1
oG2antt.Columns.Add("Column")
var_Items = oG2antt.Items
	h = var_Items.AddItem("Root 1")
	var_Items.InsertItem(h,null,"Child 1")
	var_Items.InsertItem(h,null,"Child 2")
	// var_Items.ExpandItem(h) = true
	with (oG2antt)
		TemplateDef = [dim var_Items,h]
		TemplateDef = var_Items
		TemplateDef = h
		Template = [var_Items.ExpandItem(h) = True]
	endwith
	h = var_Items.AddItem("Root 2")
	var_Items.InsertItem(h,null,"Child")
oG2antt.EndUpdate()
|
|
2029
|
How can I find if the control is running in DPI mode
local oG2antt

oG2antt = form.EXG2ANTTCHARTACTIVEXCONTROL1.nativeObject
? Str(oG2antt.FormatABC("dpi = 1 ? `normal/stretch mode` : `dpi mode`"))
|
|
2028
|
How can I change the visual appearance of the +/- buttons (method 1)
local h,oG2antt,var_Appearance,var_Items

oG2antt = form.EXG2ANTTCHARTACTIVEXCONTROL1.nativeObject
oG2antt.BeginUpdate()
var_Appearance = oG2antt.VisualAppearance
	var_Appearance.Add(1,"gBFLBCJwBAEHhEJAAEhABDwCg6AADACAxRDgMQBQKAAzAJBIYhiG4cYCgMZhXDOCYXABCEYRXBIZQ7BKNIxjSJ5BhIAAyDSJMjSRJUEhqGCWYDleYYYAKHIMQLJQKQSBcQR9EaBZBAWTpQC0OJDTJRI4TNAgbSYAAYRqoCb6loTKypaxjCQQIgkUBpGKdBynEYsDwSGyJCCJWyIbpKAwoVbcs4AYhuJpaQi+d5PFbjVT8dLAMBwLA8EwXAJ+OpfDxXU7eFKpR5fchXTI8UxXFqXZhkeQrfh7KYVRBKdBQRBEFQPJqnahqOpaXo2RoLUJKcQwHTmHYNQTALyuTALZrWeZ3XrgN74LbtZzVQauYRpbCMEr6bpoWLnFi6Ho1U4llWah1jqSweFqfxPgQQRphi+Yak0YIuqUfJegef4zluaJ3nqPJeCYH4BAeX5TDLBpVGqKRRnwf4flefZtHsX54BYAR/F+EwVnUd5eAMMJKDIChygyIQpAoEh4iIJ5JlgXIcgCXpIGoFwnGEQh6BEKBgmMIICHgIJCAiUAzgyUoAhwJohkiRgygwYpiGoKwzGIcgKCkNQNCMRIbCYCRYk4QoMiOchWDwNBjhiJJaDYTRiGiFwlCQAhOE8JBJHITIRgwZRZFCFCZBkOIUhKTRpCWAwgGYQ4El4NxlBifIWCcCYCFoaoMGaKYyG6GxlBmGJdhkCAWBIeA5g4U4QhMJAImkPIShRVxGgQJRlCIUISh+SJpnCZIeBgFgiHgO4OlOM" ;
	 +"INCISByECDQikkGhuh2JwpmqBogCKaYiC6FwhmkQ4yHgYgYiaHopiuaRakCbIsisSpGjYOwaHYKYMCkK5CA2IxrCwCwFigaJrkLTI6lcdANAEgIA=")
	var_Appearance.Add(2,"gBFLBCJwBAEHhEJAAEhABEICg6AADACAxRDgMQBQKAAzAJBIYhiG4cYCgMZhXDOCYXABCEYRXBIZQ7BKNIxjSJ5BhIAAyDSJMjSRJUEhqGCWYDleYYYAKHIMQLJQKQSBcQR9EaBZBAWTpQC0OJDTJRI4TNAgbSYAAYRqoCb6loTKypaxjCQQIgkUBpGKdBynEYsDwSGyJCCJWyIbpKAwoVbcs4AYhuJpaQi+d5PFbjVT8dLAMBwLA8EwXAJ+OpfDxXU7eFKpR5fchXTI8UxXFqXZhkeQrfh7KYVRBKdBQRBEFQPJqnahqOpaXo2RoLUJKcQwHTmHYNQTALyuTALZrWeZ3XrgN74LbtZzVQauYRpbCMEr6bpoWLnFi6Ho1U4llWah1jqSweFqfxPgQQRphi+Yak0YIuqUfJeg8X4rluaZ3niGB+AQHx/EyShjjEVYqiUR5rnmex/GAB5+AIf4gEeXJFHyXZ3gCTAygyAociMKBKEKBIeCiCZyHYFAnCEeBkh+BghFgRIegOCgYCySAgh4CAkgINAMmMNIgCcCYjn4LoLmMCJGDKC5ijIagoDMYhCAoJg1A0IxEhsJgJFiThChCY5yFYPA0GOGIYloNhNGIaIXCUJACE4TwkEkchOFSFYlFkXhUCUCQZEYTglCSMxaEkYJIBmFJhDeDZZEYPwlgmQhghaGqVDoa4bGaeY6FGGZNlmFIBGEJ4jhiZQ5AkMhAg6E5JCkRoGCUSQ6B6CYiSCBIOh+DhJmmARiWQO" ;
	 +"JtDsCJSCSBwkXSLIRicaZ6HqIIomoIguhwIpphIHoWDsJ4mCGChpmqOpGheLIOkqUo2iya4DjGJxihiQoSj4IJaDaMpCjCWoGg6PgpBiQ4tHcQJQBAgI=")
oG2antt.LinesAtRoot = -1
oG2antt.Template = [Background(180) = 16777216] // oG2antt.Background(180) = 0x1000000
oG2antt.Template = [Background(181) = 33554432] // oG2antt.Background(181) = 0x2000000
oG2antt.Columns.Add("Column")
var_Items = oG2antt.Items
	h = var_Items.AddItem("Root 1")
	var_Items.InsertItem(h,null,"Child 1")
	var_Items.InsertItem(h,null,"Child 2")
	// var_Items.ExpandItem(h) = true
	with (oG2antt)
		TemplateDef = [dim var_Items,h]
		TemplateDef = var_Items
		TemplateDef = h
		Template = [var_Items.ExpandItem(h) = True]
	endwith
	h = var_Items.AddItem("Root 2")
	var_Items.InsertItem(h,null,"Child")
oG2antt.EndUpdate()
|
|
2027
|
How can I add a summary bar once the user group by a column
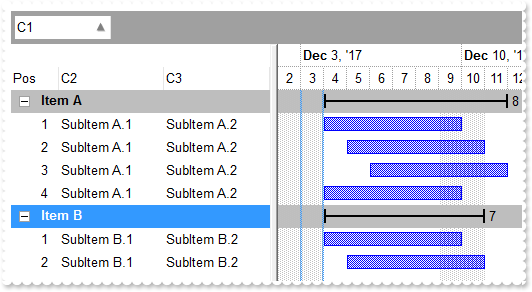
/*
with (this.EXG2ANTTCHARTACTIVEXCONTROL1.nativeObject)
	AddGroupItem = class::nativeObject_AddGroupItem
endwith
*/
// Occurs after a new Group Item has been inserted to Items collection.
function nativeObject_AddGroupItem(Item)
	local l,var_Chart,var_Items
	oG2antt = form.EXG2ANTTCHARTACTIVEXCONTROL1.nativeObject
	var_Items = oG2antt.Items
		// var_Items.ItemDividerLine(Item) = 0
		with (oG2antt)
			TemplateDef = [dim var_Items,Item]
			TemplateDef = var_Items
			TemplateDef = Item
			Template = [var_Items.ItemDividerLine(Item) = 0]
		endwith
		var_Items.AddBar(Item,"Summary","12/02/2017","12/02/2017")
		var_Items.DefineSummaryBars(Item,"",-3,"")
		l = var_Items.GroupItem(Item)
		// var_Items.CellSingleLine(Item,l) = false
		with (oG2antt)
			TemplateDef = [dim var_Items,Item,l]
			TemplateDef = var_Items
			TemplateDef = Item
			TemplateDef = l
			Template = [var_Items.CellSingleLine(Item,l) = False]
		endwith
		// var_Items.CellBold(Item,l) = true
		with (oG2antt)
			TemplateDef = [dim var_Items,Item,l]
			TemplateDef = var_Items
			TemplateDef = Item
			TemplateDef = l
			Template = [var_Items.CellBold(Item,l) = True]
		endwith
		// var_Items.ItemBackColor(Item) = 0xbebebe
		with (oG2antt)
			TemplateDef = [dim var_Items,Item]
			TemplateDef = var_Items
			TemplateDef = Item
			Template = [var_Items.ItemBackColor(Item) = 12500670]
		endwith
	// oG2antt.Chart.ItemBackColor(Item) = 0xbebebe
	var_Chart = oG2antt.Chart
	with (oG2antt)
		TemplateDef = [dim var_Chart]
		TemplateDef = var_Chart
		Template = [var_Chart.ItemBackColor(Item) = 12500670]
	endwith
return

/*
with (this.EXG2ANTTCHARTACTIVEXCONTROL1.nativeObject)
	AddItem = class::nativeObject_AddItem
endwith
*/
// Occurs after a new Item has been inserted to Items collection.
function nativeObject_AddItem(Item)
	oG2antt = form.EXG2ANTTCHARTACTIVEXCONTROL1.nativeObject
	oG2antt.Items.AddBar(Item,"Task","12/04/2017","12/10/2017")
return

local h,oG2antt,var_Bar,var_Chart,var_Column,var_Column1,var_Columns,var_Items

oG2antt = form.EXG2ANTTCHARTACTIVEXCONTROL1.nativeObject
oG2antt.BeginUpdate()
oG2antt.VisualAppearance.Add(1,"gBFLBCJwBAEHhEJAAEhABOUGACAADACAxRDgMQBQKAAzAJBIYhiG4cYCgMZhXDOCYXABCEYRXBIZQ7BKNIxjSJwFgmEgADCMQwAFBIbhrE4ZBjHGQRUgyI43RhHUBzVIUBxDEaTZLlEYJBgeHYhDJPcaUVDcWQHGyeZwjSgpKoWSJIU5NcggPDgEwTKCmKlTAKoSzJMyEmwWRAdVTZLSEaxierKPhyWT/XgAF4PfDFKRXFqXY5mKZJFqKOI8TxINgxPQMGyrBqraLqKwQGrGCQKSBhUZ3dS2JR3OSlYRuQAMVgOXoDZhPWZXbDtSzPE63NgtOR5DiGWalABoeoxRa9cz3ViCJSrGTqIoINIzZLHFQbPpdAYdP6BeIjXhhZxBBuLZXmEOh9CcNoni2N4MjWVodh+DpfBeLJinsWR9AyYwVAkGBhEAFphGiRogDEGBamkFgtjcZgHiMbgehYaQhAIEIREAaQYkcQZUHIGRUGQDBOEaBAhDYDxGkMZAkCgeoagYZAYEYAYIAWGhemICIFj8WIiCiFR5gkIhogmBoKGKJx2C6C5hniMgggqYwog0UoNGMZJiDiCZRgOLY0ECUAQICA==")
var_Chart = oG2antt.Chart
	var_Chart.LevelCount = 2
	var_Chart.FirstVisibleDate = "12/02/2017"
	// var_Chart.PaneWidth(false) = 342
	with (oG2antt)
		TemplateDef = [dim var_Chart]
		TemplateDef = var_Chart
		Template = [var_Chart.PaneWidth(False) = 342]
	endwith
	var_Bar = var_Chart.Bars.Item("Summary")
		var_Bar.StartShape = 0
		var_Bar.EndShape = 0
		var_Bar.Shape = 1
		var_Bar.Color = 0x1000000
		// var_Bar.Def(3) = "<%=%513%>"
		with (oG2antt)
			TemplateDef = [dim var_Bar]
			TemplateDef = var_Bar
			Template = [var_Bar.Def(3) = "<%=%513%>"]
		endwith
		// var_Bar.Def(4) = 18
		with (oG2antt)
			TemplateDef = [dim var_Bar]
			TemplateDef = var_Bar
			Template = [var_Bar.Def(4) = 18]
		endwith
var_Columns = oG2antt.Columns
	var_Columns.Add("C1")
	var_Columns.Add("C2")
	var_Columns.Add("C3")
	var_Column = var_Columns.Add("Pos")
		var_Column.FormatColumn = "1 pos ``"
		var_Column.AllowGroupBy = false
		var_Column.Position = 0
		var_Column.Width = 48
		var_Column.AllowSizing = false
oG2antt.SortBarVisible = true
oG2antt.SortBarCaption = "Drag a <b>column</b> header here to group by that column."
oG2antt.AllowGroupBy = true
oG2antt.HasLines = 0
oG2antt.LinesAtRoot = 0
var_Items = oG2antt.Items
	h = var_Items.AddItem("Item A")
	// var_Items.CellValue(h,1) = "SubItem A.1"
	with (oG2antt)
		TemplateDef = [dim var_Items,h]
		TemplateDef = var_Items
		TemplateDef = h
		Template = [var_Items.CellValue(h,1) = "SubItem A.1"]
	endwith
	// var_Items.CellValue(h,2) = "SubItem A.2"
	with (oG2antt)
		TemplateDef = [dim var_Items,h]
		TemplateDef = var_Items
		TemplateDef = h
		Template = [var_Items.CellValue(h,2) = "SubItem A.2"]
	endwith
	h = var_Items.AddItem("Item A")
	// var_Items.CellValue(h,1) = "SubItem A.1"
	with (oG2antt)
		TemplateDef = [dim var_Items,h]
		TemplateDef = var_Items
		TemplateDef = h
		Template = [var_Items.CellValue(h,1) = "SubItem A.1"]
	endwith
	// var_Items.CellValue(h,2) = "SubItem A.2"
	with (oG2antt)
		TemplateDef = [dim var_Items,h]
		TemplateDef = var_Items
		TemplateDef = h
		Template = [var_Items.CellValue(h,2) = "SubItem A.2"]
	endwith
	h = var_Items.AddItem("Item A")
	// var_Items.CellValue(h,1) = "SubItem A.1"
	with (oG2antt)
		TemplateDef = [dim var_Items,h]
		TemplateDef = var_Items
		TemplateDef = h
		Template = [var_Items.CellValue(h,1) = "SubItem A.1"]
	endwith
	// var_Items.CellValue(h,2) = "SubItem A.2"
	with (oG2antt)
		TemplateDef = [dim var_Items,h]
		TemplateDef = var_Items
		TemplateDef = h
		Template = [var_Items.CellValue(h,2) = "SubItem A.2"]
	endwith
	h = var_Items.AddItem("Item A")
	// var_Items.CellValue(h,1) = "SubItem A.1"
	with (oG2antt)
		TemplateDef = [dim var_Items,h]
		TemplateDef = var_Items
		TemplateDef = h
		Template = [var_Items.CellValue(h,1) = "SubItem A.1"]
	endwith
	// var_Items.CellValue(h,2) = "SubItem A.2"
	with (oG2antt)
		TemplateDef = [dim var_Items,h]
		TemplateDef = var_Items
		TemplateDef = h
		Template = [var_Items.CellValue(h,2) = "SubItem A.2"]
	endwith
	h = var_Items.AddItem("Item B")
	// var_Items.CellValue(h,1) = "SubItem B.1"
	with (oG2antt)
		TemplateDef = [dim var_Items,h]
		TemplateDef = var_Items
		TemplateDef = h
		Template = [var_Items.CellValue(h,1) = "SubItem B.1"]
	endwith
	// var_Items.CellValue(h,2) = "SubItem B.2"
	with (oG2antt)
		TemplateDef = [dim var_Items,h]
		TemplateDef = var_Items
		TemplateDef = h
		Template = [var_Items.CellValue(h,2) = "SubItem B.2"]
	endwith
	h = var_Items.AddItem("Item B")
	// var_Items.CellValue(h,1) = "SubItem B.1"
	with (oG2antt)
		TemplateDef = [dim var_Items,h]
		TemplateDef = var_Items
		TemplateDef = h
		Template = [var_Items.CellValue(h,1) = "SubItem B.1"]
	endwith
	// var_Items.CellValue(h,2) = "SubItem B.2"
	with (oG2antt)
		TemplateDef = [dim var_Items,h]
		TemplateDef = var_Items
		TemplateDef = h
		Template = [var_Items.CellValue(h,2) = "SubItem B.2"]
	endwith
var_Column1 = oG2antt.Columns.Item(0)
	var_Column1.SortOrder = 1
oG2antt.EndUpdate()
|
|
2026
|
Is it possible to display no +/- button for grouped items
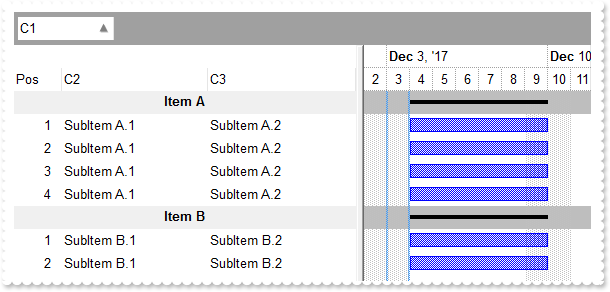
/*
with (this.EXG2ANTTCHARTACTIVEXCONTROL1.nativeObject)
	AddGroupItem = class::nativeObject_AddGroupItem
endwith
*/
// Occurs after a new Group Item has been inserted to Items collection.
function nativeObject_AddGroupItem(Item)
	local l,var_Chart,var_Items
	oG2antt = form.EXG2ANTTCHARTACTIVEXCONTROL1.nativeObject
	var_Items = oG2antt.Items
		// var_Items.ItemDividerLine(Item) = 0
		with (oG2antt)
			TemplateDef = [dim var_Items,Item]
			TemplateDef = var_Items
			TemplateDef = Item
			Template = [var_Items.ItemDividerLine(Item) = 0]
		endwith
		var_Items.AddBar(Item,"Progress","12/02/2017","12/02/2017")
		var_Items.DefineSummaryBars(Item,"",-3,"")
		l = var_Items.GroupItem(Item)
		// var_Items.CellSingleLine(Item,l) = false
		with (oG2antt)
			TemplateDef = [dim var_Items,Item,l]
			TemplateDef = var_Items
			TemplateDef = Item
			TemplateDef = l
			Template = [var_Items.CellSingleLine(Item,l) = False]
		endwith
		// var_Items.CellBold(Item,l) = true
		with (oG2antt)
			TemplateDef = [dim var_Items,Item,l]
			TemplateDef = var_Items
			TemplateDef = Item
			TemplateDef = l
			Template = [var_Items.CellBold(Item,l) = True]
		endwith
		// var_Items.ItemBackColor(Item) = 0xbebebe
		with (oG2antt)
			TemplateDef = [dim var_Items,Item]
			TemplateDef = var_Items
			TemplateDef = Item
			Template = [var_Items.ItemBackColor(Item) = 12500670]
		endwith
	// oG2antt.Chart.ItemBackColor(Item) = 0xbebebe
	var_Chart = oG2antt.Chart
	with (oG2antt)
		TemplateDef = [dim var_Chart]
		TemplateDef = var_Chart
		Template = [var_Chart.ItemBackColor(Item) = 12500670]
	endwith
return

/*
with (this.EXG2ANTTCHARTACTIVEXCONTROL1.nativeObject)
	AddItem = class::nativeObject_AddItem
endwith
*/
// Occurs after a new Item has been inserted to Items collection.
function nativeObject_AddItem(Item)
	oG2antt = form.EXG2ANTTCHARTACTIVEXCONTROL1.nativeObject
	oG2antt.Items.AddBar(Item,"Task","12/04/2017","12/10/2017")
return

local h,oG2antt,var_Chart,var_Column,var_Column1,var_Columns,var_Items

oG2antt = form.EXG2ANTTCHARTACTIVEXCONTROL1.nativeObject
oG2antt.BeginUpdate()
var_Chart = oG2antt.Chart
	var_Chart.LevelCount = 2
	var_Chart.FirstVisibleDate = "12/02/2017"
	// var_Chart.PaneWidth(false) = 342
	with (oG2antt)
		TemplateDef = [dim var_Chart]
		TemplateDef = var_Chart
		Template = [var_Chart.PaneWidth(False) = 342]
	endwith
var_Columns = oG2antt.Columns
	var_Columns.Add("C1")
	var_Columns.Add("C2")
	var_Columns.Add("C3")
	var_Column = var_Columns.Add("Pos")
		var_Column.FormatColumn = "1 pos ``"
		var_Column.AllowGroupBy = false
		var_Column.Position = 0
		var_Column.Width = 48
		var_Column.AllowSizing = false
oG2antt.SortBarVisible = true
oG2antt.SortBarCaption = "Drag a <b>column</b> header here to group by that column."
oG2antt.AllowGroupBy = true
oG2antt.HasLines = 0
oG2antt.LinesAtRoot = 0
var_Items = oG2antt.Items
	h = var_Items.AddItem("Item A")
	// var_Items.CellValue(h,1) = "SubItem A.1"
	with (oG2antt)
		TemplateDef = [dim var_Items,h]
		TemplateDef = var_Items
		TemplateDef = h
		Template = [var_Items.CellValue(h,1) = "SubItem A.1"]
	endwith
	// var_Items.CellValue(h,2) = "SubItem A.2"
	with (oG2antt)
		TemplateDef = [dim var_Items,h]
		TemplateDef = var_Items
		TemplateDef = h
		Template = [var_Items.CellValue(h,2) = "SubItem A.2"]
	endwith
	h = var_Items.AddItem("Item A")
	// var_Items.CellValue(h,1) = "SubItem A.1"
	with (oG2antt)
		TemplateDef = [dim var_Items,h]
		TemplateDef = var_Items
		TemplateDef = h
		Template = [var_Items.CellValue(h,1) = "SubItem A.1"]
	endwith
	// var_Items.CellValue(h,2) = "SubItem A.2"
	with (oG2antt)
		TemplateDef = [dim var_Items,h]
		TemplateDef = var_Items
		TemplateDef = h
		Template = [var_Items.CellValue(h,2) = "SubItem A.2"]
	endwith
	h = var_Items.AddItem("Item A")
	// var_Items.CellValue(h,1) = "SubItem A.1"
	with (oG2antt)
		TemplateDef = [dim var_Items,h]
		TemplateDef = var_Items
		TemplateDef = h
		Template = [var_Items.CellValue(h,1) = "SubItem A.1"]
	endwith
	// var_Items.CellValue(h,2) = "SubItem A.2"
	with (oG2antt)
		TemplateDef = [dim var_Items,h]
		TemplateDef = var_Items
		TemplateDef = h
		Template = [var_Items.CellValue(h,2) = "SubItem A.2"]
	endwith
	h = var_Items.AddItem("Item A")
	// var_Items.CellValue(h,1) = "SubItem A.1"
	with (oG2antt)
		TemplateDef = [dim var_Items,h]
		TemplateDef = var_Items
		TemplateDef = h
		Template = [var_Items.CellValue(h,1) = "SubItem A.1"]
	endwith
	// var_Items.CellValue(h,2) = "SubItem A.2"
	with (oG2antt)
		TemplateDef = [dim var_Items,h]
		TemplateDef = var_Items
		TemplateDef = h
		Template = [var_Items.CellValue(h,2) = "SubItem A.2"]
	endwith
	h = var_Items.AddItem("Item B")
	// var_Items.CellValue(h,1) = "SubItem B.1"
	with (oG2antt)
		TemplateDef = [dim var_Items,h]
		TemplateDef = var_Items
		TemplateDef = h
		Template = [var_Items.CellValue(h,1) = "SubItem B.1"]
	endwith
	// var_Items.CellValue(h,2) = "SubItem B.2"
	with (oG2antt)
		TemplateDef = [dim var_Items,h]
		TemplateDef = var_Items
		TemplateDef = h
		Template = [var_Items.CellValue(h,2) = "SubItem B.2"]
	endwith
	h = var_Items.AddItem("Item B")
	// var_Items.CellValue(h,1) = "SubItem B.1"
	with (oG2antt)
		TemplateDef = [dim var_Items,h]
		TemplateDef = var_Items
		TemplateDef = h
		Template = [var_Items.CellValue(h,1) = "SubItem B.1"]
	endwith
	// var_Items.CellValue(h,2) = "SubItem B.2"
	with (oG2antt)
		TemplateDef = [dim var_Items,h]
		TemplateDef = var_Items
		TemplateDef = h
		Template = [var_Items.CellValue(h,2) = "SubItem B.2"]
	endwith
var_Column1 = oG2antt.Columns.Item(0)
	var_Column1.SortOrder = 1
	var_Column1.Alignment = 1
	// var_Column1.Def(4) = 15790320
	with (oG2antt)
		TemplateDef = [dim var_Column1]
		TemplateDef = var_Column1
		Template = [var_Column1.Def(4) = 15790320]
	endwith
oG2antt.EndUpdate()
|
|
2025
|
How can I change the label, caption or the formula of the grouped items
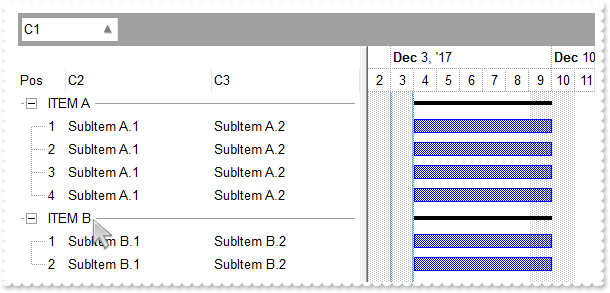
/*
with (this.EXG2ANTTCHARTACTIVEXCONTROL1.nativeObject)
	AddGroupItem = class::nativeObject_AddGroupItem
endwith
*/
// Occurs after a new Group Item has been inserted to Items collection.
function nativeObject_AddGroupItem(Item)
	local var_Items
	oG2antt = form.EXG2ANTTCHARTACTIVEXCONTROL1.nativeObject
	var_Items = oG2antt.Items
		var_Items.AddBar(Item,"Progress","12/02/2017","12/02/2017")
		var_Items.DefineSummaryBars(Item,"",-3,"")
return

/*
with (this.EXG2ANTTCHARTACTIVEXCONTROL1.nativeObject)
	AddItem = class::nativeObject_AddItem
endwith
*/
// Occurs after a new Item has been inserted to Items collection.
function nativeObject_AddItem(Item)
	oG2antt = form.EXG2ANTTCHARTACTIVEXCONTROL1.nativeObject
	oG2antt.Items.AddBar(Item,"Task","12/04/2017","12/10/2017")
return

local h,oG2antt,var_Chart,var_Column,var_Column1,var_Columns,var_Items

oG2antt = form.EXG2ANTTCHARTACTIVEXCONTROL1.nativeObject
oG2antt.BeginUpdate()
var_Chart = oG2antt.Chart
	var_Chart.LevelCount = 2
	var_Chart.FirstVisibleDate = "12/02/2017"
	// var_Chart.PaneWidth(false) = 342
	with (oG2antt)
		TemplateDef = [dim var_Chart]
		TemplateDef = var_Chart
		Template = [var_Chart.PaneWidth(False) = 342]
	endwith
var_Columns = oG2antt.Columns
	var_Column = var_Columns.Add("C1")
		var_Column.GroupByTotalField = ""
		var_Column.GroupByFormatCell = "upper(value)"
	var_Columns.Add("C2")
	var_Columns.Add("C3")
	var_Column1 = var_Columns.Add("Pos")
		var_Column1.FormatColumn = "1 pos ``"
		var_Column1.AllowGroupBy = false
		var_Column1.Position = 0
		var_Column1.Width = 48
		var_Column1.AllowSizing = false
oG2antt.SortBarVisible = true
oG2antt.SortBarCaption = "Drag a <b>column</b> header here to group by that column."
oG2antt.AllowGroupBy = true
var_Items = oG2antt.Items
	h = var_Items.AddItem("Item A")
	// var_Items.CellValue(h,1) = "SubItem A.1"
	with (oG2antt)
		TemplateDef = [dim var_Items,h]
		TemplateDef = var_Items
		TemplateDef = h
		Template = [var_Items.CellValue(h,1) = "SubItem A.1"]
	endwith
	// var_Items.CellValue(h,2) = "SubItem A.2"
	with (oG2antt)
		TemplateDef = [dim var_Items,h]
		TemplateDef = var_Items
		TemplateDef = h
		Template = [var_Items.CellValue(h,2) = "SubItem A.2"]
	endwith
	h = var_Items.AddItem("Item A")
	// var_Items.CellValue(h,1) = "SubItem A.1"
	with (oG2antt)
		TemplateDef = [dim var_Items,h]
		TemplateDef = var_Items
		TemplateDef = h
		Template = [var_Items.CellValue(h,1) = "SubItem A.1"]
	endwith
	// var_Items.CellValue(h,2) = "SubItem A.2"
	with (oG2antt)
		TemplateDef = [dim var_Items,h]
		TemplateDef = var_Items
		TemplateDef = h
		Template = [var_Items.CellValue(h,2) = "SubItem A.2"]
	endwith
	h = var_Items.AddItem("Item A")
	// var_Items.CellValue(h,1) = "SubItem A.1"
	with (oG2antt)
		TemplateDef = [dim var_Items,h]
		TemplateDef = var_Items
		TemplateDef = h
		Template = [var_Items.CellValue(h,1) = "SubItem A.1"]
	endwith
	// var_Items.CellValue(h,2) = "SubItem A.2"
	with (oG2antt)
		TemplateDef = [dim var_Items,h]
		TemplateDef = var_Items
		TemplateDef = h
		Template = [var_Items.CellValue(h,2) = "SubItem A.2"]
	endwith
	h = var_Items.AddItem("Item A")
	// var_Items.CellValue(h,1) = "SubItem A.1"
	with (oG2antt)
		TemplateDef = [dim var_Items,h]
		TemplateDef = var_Items
		TemplateDef = h
		Template = [var_Items.CellValue(h,1) = "SubItem A.1"]
	endwith
	// var_Items.CellValue(h,2) = "SubItem A.2"
	with (oG2antt)
		TemplateDef = [dim var_Items,h]
		TemplateDef = var_Items
		TemplateDef = h
		Template = [var_Items.CellValue(h,2) = "SubItem A.2"]
	endwith
	h = var_Items.AddItem("Item B")
	// var_Items.CellValue(h,1) = "SubItem B.1"
	with (oG2antt)
		TemplateDef = [dim var_Items,h]
		TemplateDef = var_Items
		TemplateDef = h
		Template = [var_Items.CellValue(h,1) = "SubItem B.1"]
	endwith
	// var_Items.CellValue(h,2) = "SubItem B.2"
	with (oG2antt)
		TemplateDef = [dim var_Items,h]
		TemplateDef = var_Items
		TemplateDef = h
		Template = [var_Items.CellValue(h,2) = "SubItem B.2"]
	endwith
	h = var_Items.AddItem("Item B")
	// var_Items.CellValue(h,1) = "SubItem B.1"
	with (oG2antt)
		TemplateDef = [dim var_Items,h]
		TemplateDef = var_Items
		TemplateDef = h
		Template = [var_Items.CellValue(h,1) = "SubItem B.1"]
	endwith
	// var_Items.CellValue(h,2) = "SubItem B.2"
	with (oG2antt)
		TemplateDef = [dim var_Items,h]
		TemplateDef = var_Items
		TemplateDef = h
		Template = [var_Items.CellValue(h,2) = "SubItem B.2"]
	endwith
oG2antt.Columns.Item(0).SortOrder = 1
oG2antt.EndUpdate()
|
|
2024
|
How can I change the aspect of grouped items
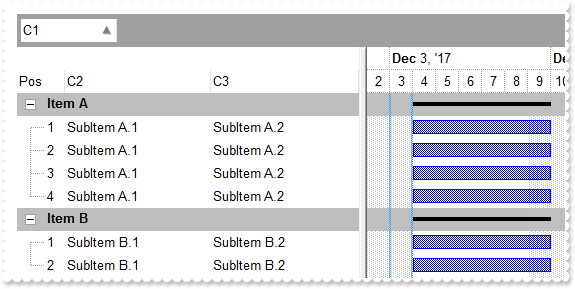
/*
with (this.EXG2ANTTCHARTACTIVEXCONTROL1.nativeObject)
	AddGroupItem = class::nativeObject_AddGroupItem
endwith
*/
// Occurs after a new Group Item has been inserted to Items collection.
function nativeObject_AddGroupItem(Item)
	local l,var_Chart,var_Items
	oG2antt = form.EXG2ANTTCHARTACTIVEXCONTROL1.nativeObject
	var_Items = oG2antt.Items
		// var_Items.ItemDividerLine(Item) = 0
		with (oG2antt)
			TemplateDef = [dim var_Items,Item]
			TemplateDef = var_Items
			TemplateDef = Item
			Template = [var_Items.ItemDividerLine(Item) = 0]
		endwith
		var_Items.AddBar(Item,"Progress","12/02/2017","12/02/2017")
		var_Items.DefineSummaryBars(Item,"",-3,"")
		l = var_Items.GroupItem(Item)
		// var_Items.CellSingleLine(Item,l) = false
		with (oG2antt)
			TemplateDef = [dim var_Items,Item,l]
			TemplateDef = var_Items
			TemplateDef = Item
			TemplateDef = l
			Template = [var_Items.CellSingleLine(Item,l) = False]
		endwith
		// var_Items.CellBold(Item,l) = true
		with (oG2antt)
			TemplateDef = [dim var_Items,Item,l]
			TemplateDef = var_Items
			TemplateDef = Item
			TemplateDef = l
			Template = [var_Items.CellBold(Item,l) = True]
		endwith
		// var_Items.ItemBackColor(Item) = 0xbebebe
		with (oG2antt)
			TemplateDef = [dim var_Items,Item]
			TemplateDef = var_Items
			TemplateDef = Item
			Template = [var_Items.ItemBackColor(Item) = 12500670]
		endwith
	// oG2antt.Chart.ItemBackColor(Item) = 0xbebebe
	var_Chart = oG2antt.Chart
	with (oG2antt)
		TemplateDef = [dim var_Chart]
		TemplateDef = var_Chart
		Template = [var_Chart.ItemBackColor(Item) = 12500670]
	endwith
return

/*
with (this.EXG2ANTTCHARTACTIVEXCONTROL1.nativeObject)
	AddItem = class::nativeObject_AddItem
endwith
*/
// Occurs after a new Item has been inserted to Items collection.
function nativeObject_AddItem(Item)
	oG2antt = form.EXG2ANTTCHARTACTIVEXCONTROL1.nativeObject
	oG2antt.Items.AddBar(Item,"Task","12/04/2017","12/10/2017")
return

local h,oG2antt,var_Chart,var_Column,var_Columns,var_Items

oG2antt = form.EXG2ANTTCHARTACTIVEXCONTROL1.nativeObject
oG2antt.BeginUpdate()
var_Chart = oG2antt.Chart
	var_Chart.LevelCount = 2
	var_Chart.FirstVisibleDate = "12/02/2017"
	// var_Chart.PaneWidth(false) = 342
	with (oG2antt)
		TemplateDef = [dim var_Chart]
		TemplateDef = var_Chart
		Template = [var_Chart.PaneWidth(False) = 342]
	endwith
var_Columns = oG2antt.Columns
	var_Columns.Add("C1")
	var_Columns.Add("C2")
	var_Columns.Add("C3")
	var_Column = var_Columns.Add("Pos")
		var_Column.FormatColumn = "1 pos ``"
		var_Column.AllowGroupBy = false
		var_Column.Position = 0
		var_Column.Width = 48
		var_Column.AllowSizing = false
oG2antt.SortBarVisible = true
oG2antt.SortBarCaption = "Drag a <b>column</b> header here to group by that column."
oG2antt.AllowGroupBy = true
var_Items = oG2antt.Items
	h = var_Items.AddItem("Item A")
	// var_Items.CellValue(h,1) = "SubItem A.1"
	with (oG2antt)
		TemplateDef = [dim var_Items,h]
		TemplateDef = var_Items
		TemplateDef = h
		Template = [var_Items.CellValue(h,1) = "SubItem A.1"]
	endwith
	// var_Items.CellValue(h,2) = "SubItem A.2"
	with (oG2antt)
		TemplateDef = [dim var_Items,h]
		TemplateDef = var_Items
		TemplateDef = h
		Template = [var_Items.CellValue(h,2) = "SubItem A.2"]
	endwith
	h = var_Items.AddItem("Item A")
	// var_Items.CellValue(h,1) = "SubItem A.1"
	with (oG2antt)
		TemplateDef = [dim var_Items,h]
		TemplateDef = var_Items
		TemplateDef = h
		Template = [var_Items.CellValue(h,1) = "SubItem A.1"]
	endwith
	// var_Items.CellValue(h,2) = "SubItem A.2"
	with (oG2antt)
		TemplateDef = [dim var_Items,h]
		TemplateDef = var_Items
		TemplateDef = h
		Template = [var_Items.CellValue(h,2) = "SubItem A.2"]
	endwith
	h = var_Items.AddItem("Item A")
	// var_Items.CellValue(h,1) = "SubItem A.1"
	with (oG2antt)
		TemplateDef = [dim var_Items,h]
		TemplateDef = var_Items
		TemplateDef = h
		Template = [var_Items.CellValue(h,1) = "SubItem A.1"]
	endwith
	// var_Items.CellValue(h,2) = "SubItem A.2"
	with (oG2antt)
		TemplateDef = [dim var_Items,h]
		TemplateDef = var_Items
		TemplateDef = h
		Template = [var_Items.CellValue(h,2) = "SubItem A.2"]
	endwith
	h = var_Items.AddItem("Item A")
	// var_Items.CellValue(h,1) = "SubItem A.1"
	with (oG2antt)
		TemplateDef = [dim var_Items,h]
		TemplateDef = var_Items
		TemplateDef = h
		Template = [var_Items.CellValue(h,1) = "SubItem A.1"]
	endwith
	// var_Items.CellValue(h,2) = "SubItem A.2"
	with (oG2antt)
		TemplateDef = [dim var_Items,h]
		TemplateDef = var_Items
		TemplateDef = h
		Template = [var_Items.CellValue(h,2) = "SubItem A.2"]
	endwith
	h = var_Items.AddItem("Item B")
	// var_Items.CellValue(h,1) = "SubItem B.1"
	with (oG2antt)
		TemplateDef = [dim var_Items,h]
		TemplateDef = var_Items
		TemplateDef = h
		Template = [var_Items.CellValue(h,1) = "SubItem B.1"]
	endwith
	// var_Items.CellValue(h,2) = "SubItem B.2"
	with (oG2antt)
		TemplateDef = [dim var_Items,h]
		TemplateDef = var_Items
		TemplateDef = h
		Template = [var_Items.CellValue(h,2) = "SubItem B.2"]
	endwith
	h = var_Items.AddItem("Item B")
	// var_Items.CellValue(h,1) = "SubItem B.1"
	with (oG2antt)
		TemplateDef = [dim var_Items,h]
		TemplateDef = var_Items
		TemplateDef = h
		Template = [var_Items.CellValue(h,1) = "SubItem B.1"]
	endwith
	// var_Items.CellValue(h,2) = "SubItem B.2"
	with (oG2antt)
		TemplateDef = [dim var_Items,h]
		TemplateDef = var_Items
		TemplateDef = h
		Template = [var_Items.CellValue(h,2) = "SubItem B.2"]
	endwith
oG2antt.Columns.Item(0).SortOrder = 1
oG2antt.EndUpdate()
|
|
2023
|
How can I collapse all items when the user performs a grouping
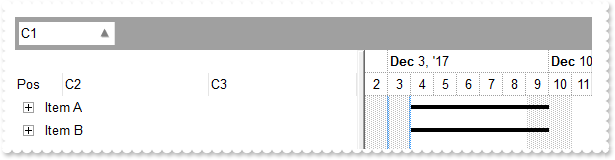
/*
with (this.EXG2ANTTCHARTACTIVEXCONTROL1.nativeObject)
	AddGroupItem = class::nativeObject_AddGroupItem
endwith
*/
// Occurs after a new Group Item has been inserted to Items collection.
function nativeObject_AddGroupItem(Item)
	local var_Items
	oG2antt = form.EXG2ANTTCHARTACTIVEXCONTROL1.nativeObject
	var_Items = oG2antt.Items
		// var_Items.ExpandItem(Item) = false
		with (oG2antt)
			TemplateDef = [dim var_Items,Item]
			TemplateDef = var_Items
			TemplateDef = Item
			Template = [var_Items.ExpandItem(Item) = False]
		endwith
		// var_Items.ItemDividerLine(Item) = 0
		with (oG2antt)
			TemplateDef = [dim var_Items,Item]
			TemplateDef = var_Items
			TemplateDef = Item
			Template = [var_Items.ItemDividerLine(Item) = 0]
		endwith
		var_Items.AddBar(Item,"Progress","12/02/2017","12/02/2017")
		var_Items.DefineSummaryBars(Item,"",-3,"")
return

/*
with (this.EXG2ANTTCHARTACTIVEXCONTROL1.nativeObject)
	AddItem = class::nativeObject_AddItem
endwith
*/
// Occurs after a new Item has been inserted to Items collection.
function nativeObject_AddItem(Item)
	oG2antt = form.EXG2ANTTCHARTACTIVEXCONTROL1.nativeObject
	oG2antt.Items.AddBar(Item,"Task","12/04/2017","12/10/2017")
return

local h,oG2antt,var_Chart,var_Column,var_Columns,var_Items

oG2antt = form.EXG2ANTTCHARTACTIVEXCONTROL1.nativeObject
oG2antt.BeginUpdate()
var_Chart = oG2antt.Chart
	var_Chart.LevelCount = 2
	var_Chart.FirstVisibleDate = "12/02/2017"
	// var_Chart.PaneWidth(false) = 342
	with (oG2antt)
		TemplateDef = [dim var_Chart]
		TemplateDef = var_Chart
		Template = [var_Chart.PaneWidth(False) = 342]
	endwith
var_Columns = oG2antt.Columns
	var_Columns.Add("C1")
	var_Columns.Add("C2")
	var_Columns.Add("C3")
	var_Column = var_Columns.Add("Pos")
		var_Column.FormatColumn = "1 pos ``"
		var_Column.AllowGroupBy = false
		var_Column.Position = 0
		var_Column.Width = 48
		var_Column.AllowSizing = false
oG2antt.SortBarVisible = true
oG2antt.SortBarCaption = "Drag a <b>column</b> header here to group by that column."
oG2antt.AllowGroupBy = true
var_Items = oG2antt.Items
	h = var_Items.AddItem("Item A")
	// var_Items.CellValue(h,1) = "SubItem A.1"
	with (oG2antt)
		TemplateDef = [dim var_Items,h]
		TemplateDef = var_Items
		TemplateDef = h
		Template = [var_Items.CellValue(h,1) = "SubItem A.1"]
	endwith
	// var_Items.CellValue(h,2) = "SubItem A.2"
	with (oG2antt)
		TemplateDef = [dim var_Items,h]
		TemplateDef = var_Items
		TemplateDef = h
		Template = [var_Items.CellValue(h,2) = "SubItem A.2"]
	endwith
	h = var_Items.AddItem("Item A")
	// var_Items.CellValue(h,1) = "SubItem A.1"
	with (oG2antt)
		TemplateDef = [dim var_Items,h]
		TemplateDef = var_Items
		TemplateDef = h
		Template = [var_Items.CellValue(h,1) = "SubItem A.1"]
	endwith
	// var_Items.CellValue(h,2) = "SubItem A.2"
	with (oG2antt)
		TemplateDef = [dim var_Items,h]
		TemplateDef = var_Items
		TemplateDef = h
		Template = [var_Items.CellValue(h,2) = "SubItem A.2"]
	endwith
	h = var_Items.AddItem("Item A")
	// var_Items.CellValue(h,1) = "SubItem A.1"
	with (oG2antt)
		TemplateDef = [dim var_Items,h]
		TemplateDef = var_Items
		TemplateDef = h
		Template = [var_Items.CellValue(h,1) = "SubItem A.1"]
	endwith
	// var_Items.CellValue(h,2) = "SubItem A.2"
	with (oG2antt)
		TemplateDef = [dim var_Items,h]
		TemplateDef = var_Items
		TemplateDef = h
		Template = [var_Items.CellValue(h,2) = "SubItem A.2"]
	endwith
	h = var_Items.AddItem("Item A")
	// var_Items.CellValue(h,1) = "SubItem A.1"
	with (oG2antt)
		TemplateDef = [dim var_Items,h]
		TemplateDef = var_Items
		TemplateDef = h
		Template = [var_Items.CellValue(h,1) = "SubItem A.1"]
	endwith
	// var_Items.CellValue(h,2) = "SubItem A.2"
	with (oG2antt)
		TemplateDef = [dim var_Items,h]
		TemplateDef = var_Items
		TemplateDef = h
		Template = [var_Items.CellValue(h,2) = "SubItem A.2"]
	endwith
	h = var_Items.AddItem("Item B")
	// var_Items.CellValue(h,1) = "SubItem B.1"
	with (oG2antt)
		TemplateDef = [dim var_Items,h]
		TemplateDef = var_Items
		TemplateDef = h
		Template = [var_Items.CellValue(h,1) = "SubItem B.1"]
	endwith
	// var_Items.CellValue(h,2) = "SubItem B.2"
	with (oG2antt)
		TemplateDef = [dim var_Items,h]
		TemplateDef = var_Items
		TemplateDef = h
		Template = [var_Items.CellValue(h,2) = "SubItem B.2"]
	endwith
	h = var_Items.AddItem("Item B")
	// var_Items.CellValue(h,1) = "SubItem B.1"
	with (oG2antt)
		TemplateDef = [dim var_Items,h]
		TemplateDef = var_Items
		TemplateDef = h
		Template = [var_Items.CellValue(h,1) = "SubItem B.1"]
	endwith
	// var_Items.CellValue(h,2) = "SubItem B.2"
	with (oG2antt)
		TemplateDef = [dim var_Items,h]
		TemplateDef = var_Items
		TemplateDef = h
		Template = [var_Items.CellValue(h,2) = "SubItem B.2"]
	endwith
oG2antt.Columns.Item(0).SortOrder = 1
oG2antt.EndUpdate()
|
|
2022
|
Is it possible to select columns that user can drop to the sort bar, when using the Group By feature
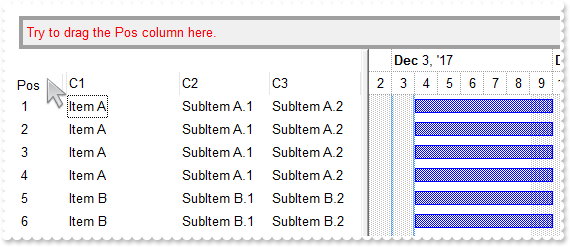
/*
with (this.EXG2ANTTCHARTACTIVEXCONTROL1.nativeObject)
	AddItem = class::nativeObject_AddItem
endwith
*/
// Occurs after a new Item has been inserted to Items collection.
function nativeObject_AddItem(Item)
	oG2antt = form.EXG2ANTTCHARTACTIVEXCONTROL1.nativeObject
	oG2antt.Items.AddBar(Item,"Task","12/04/2017","12/10/2017")
return

local h,oG2antt,var_Chart,var_Column,var_Columns,var_Items

oG2antt = form.EXG2ANTTCHARTACTIVEXCONTROL1.nativeObject
oG2antt.BeginUpdate()
var_Chart = oG2antt.Chart
	var_Chart.LevelCount = 2
	var_Chart.FirstVisibleDate = "12/02/2017"
	// var_Chart.PaneWidth(false) = 342
	with (oG2antt)
		TemplateDef = [dim var_Chart]
		TemplateDef = var_Chart
		Template = [var_Chart.PaneWidth(False) = 342]
	endwith
var_Columns = oG2antt.Columns
	var_Columns.Add("C1")
	var_Columns.Add("C2")
	var_Columns.Add("C3")
	var_Column = var_Columns.Add("Pos")
		var_Column.FormatColumn = "1 pos ``"
		var_Column.AllowGroupBy = false
		var_Column.Position = 0
		var_Column.Width = 48
		var_Column.AllowSizing = false
oG2antt.SortBarVisible = true
oG2antt.SortBarCaption = "<fgcolor=FF0000>Try to drag the Pos column here."
oG2antt.AllowGroupBy = true
var_Items = oG2antt.Items
	h = var_Items.AddItem("Item A")
	// var_Items.CellValue(h,1) = "SubItem A.1"
	with (oG2antt)
		TemplateDef = [dim var_Items,h]
		TemplateDef = var_Items
		TemplateDef = h
		Template = [var_Items.CellValue(h,1) = "SubItem A.1"]
	endwith
	// var_Items.CellValue(h,2) = "SubItem A.2"
	with (oG2antt)
		TemplateDef = [dim var_Items,h]
		TemplateDef = var_Items
		TemplateDef = h
		Template = [var_Items.CellValue(h,2) = "SubItem A.2"]
	endwith
	h = var_Items.AddItem("Item A")
	// var_Items.CellValue(h,1) = "SubItem A.1"
	with (oG2antt)
		TemplateDef = [dim var_Items,h]
		TemplateDef = var_Items
		TemplateDef = h
		Template = [var_Items.CellValue(h,1) = "SubItem A.1"]
	endwith
	// var_Items.CellValue(h,2) = "SubItem A.2"
	with (oG2antt)
		TemplateDef = [dim var_Items,h]
		TemplateDef = var_Items
		TemplateDef = h
		Template = [var_Items.CellValue(h,2) = "SubItem A.2"]
	endwith
	h = var_Items.AddItem("Item A")
	// var_Items.CellValue(h,1) = "SubItem A.1"
	with (oG2antt)
		TemplateDef = [dim var_Items,h]
		TemplateDef = var_Items
		TemplateDef = h
		Template = [var_Items.CellValue(h,1) = "SubItem A.1"]
	endwith
	// var_Items.CellValue(h,2) = "SubItem A.2"
	with (oG2antt)
		TemplateDef = [dim var_Items,h]
		TemplateDef = var_Items
		TemplateDef = h
		Template = [var_Items.CellValue(h,2) = "SubItem A.2"]
	endwith
	h = var_Items.AddItem("Item A")
	// var_Items.CellValue(h,1) = "SubItem A.1"
	with (oG2antt)
		TemplateDef = [dim var_Items,h]
		TemplateDef = var_Items
		TemplateDef = h
		Template = [var_Items.CellValue(h,1) = "SubItem A.1"]
	endwith
	// var_Items.CellValue(h,2) = "SubItem A.2"
	with (oG2antt)
		TemplateDef = [dim var_Items,h]
		TemplateDef = var_Items
		TemplateDef = h
		Template = [var_Items.CellValue(h,2) = "SubItem A.2"]
	endwith
	h = var_Items.AddItem("Item B")
	// var_Items.CellValue(h,1) = "SubItem B.1"
	with (oG2antt)
		TemplateDef = [dim var_Items,h]
		TemplateDef = var_Items
		TemplateDef = h
		Template = [var_Items.CellValue(h,1) = "SubItem B.1"]
	endwith
	// var_Items.CellValue(h,2) = "SubItem B.2"
	with (oG2antt)
		TemplateDef = [dim var_Items,h]
		TemplateDef = var_Items
		TemplateDef = h
		Template = [var_Items.CellValue(h,2) = "SubItem B.2"]
	endwith
	h = var_Items.AddItem("Item B")
	// var_Items.CellValue(h,1) = "SubItem B.1"
	with (oG2antt)
		TemplateDef = [dim var_Items,h]
		TemplateDef = var_Items
		TemplateDef = h
		Template = [var_Items.CellValue(h,1) = "SubItem B.1"]
	endwith
	// var_Items.CellValue(h,2) = "SubItem B.2"
	with (oG2antt)
		TemplateDef = [dim var_Items,h]
		TemplateDef = var_Items
		TemplateDef = h
		Template = [var_Items.CellValue(h,2) = "SubItem B.2"]
	endwith
oG2antt.EndUpdate()
|
|
2021
|
How can I filter for the type of the bars I have in my chart
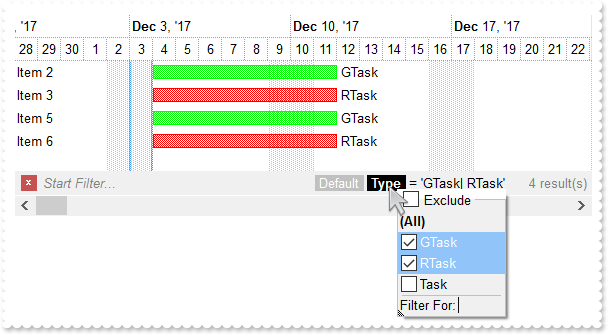
local oG2antt,var_Bar,var_Bar1,var_Bar2,var_Chart,var_Column,var_Column1,var_Column2,var_Items

oG2antt = form.EXG2ANTTCHARTACTIVEXCONTROL1.nativeObject
oG2antt.BeginUpdate()
var_Chart = oG2antt.Chart
	var_Chart.LevelCount = 2
	var_Chart.FirstVisibleDate = "11/28/2017"
	// var_Chart.PaneWidth(false) = 0
	with (oG2antt)
		TemplateDef = [dim var_Chart]
		TemplateDef = var_Chart
		Template = [var_Chart.PaneWidth(False) = 0]
	endwith
	var_Bar = var_Chart.Bars.Item("Task")
		// var_Bar.Def(3) = "<%=%0%>"
		with (oG2antt)
			TemplateDef = [dim var_Bar]
			TemplateDef = var_Bar
			Template = [var_Bar.Def(3) = "<%=%0%>"]
		endwith
		// var_Bar.Def(4) = 18
		with (oG2antt)
			TemplateDef = [dim var_Bar]
			TemplateDef = var_Bar
			Template = [var_Bar.Def(4) = 18]
		endwith
	var_Bar1 = var_Chart.Bars.Copy("Task","GTask")
		// var_Bar1.Def(3) = "<%=%0%>"
		with (oG2antt)
			TemplateDef = [dim var_Bar1]
			TemplateDef = var_Bar1
			Template = [var_Bar1.Def(3) = "<%=%0%>"]
		endwith
		// var_Bar1.Def(4) = 18
		with (oG2antt)
			TemplateDef = [dim var_Bar1]
			TemplateDef = var_Bar1
			Template = [var_Bar1.Def(4) = 18]
		endwith
		var_Bar1.Color = 0xff00
	var_Bar2 = var_Chart.Bars.Copy("Task","RTask")
		// var_Bar2.Def(3) = "<%=%0%>"
		with (oG2antt)
			TemplateDef = [dim var_Bar2]
			TemplateDef = var_Bar2
			Template = [var_Bar2.Def(3) = "<%=%0%>"]
		endwith
		// var_Bar2.Def(4) = 18
		with (oG2antt)
			TemplateDef = [dim var_Bar2]
			TemplateDef = var_Bar2
			Template = [var_Bar2.Def(4) = 18]
		endwith
		var_Bar2.Color = 0xff
	var_Chart.ColumnsFormatLevel = "0"
oG2antt.OnResizeControl = 129 /*exDisableSplitter | exResizeChart*/
var_Column = oG2antt.Columns.Add("Default")
	var_Column.DisplayFilterButton = true
	var_Column.FilterList = 9504 /*exShowExclude | exShowFocusItem | exShowCheckBox | exSortItemsAsc*/
var_Column1 = oG2antt.Columns.Add("Type")
	// var_Column1.Def(19) = ""
	with (oG2antt)
		TemplateDef = [dim var_Column1]
		TemplateDef = var_Column1
		Template = [var_Column1.Def(19) = ""]
	endwith
	// var_Column1.Def(18) = 0
	with (oG2antt)
		TemplateDef = [dim var_Column1]
		TemplateDef = var_Column1
		Template = [var_Column1.Def(18) = 0]
	endwith
	var_Column1.Visible = false
	var_Column1.DisplayFilterButton = true
	var_Column1.FilterList = 9504 /*exShowExclude | exShowFocusItem | exShowCheckBox | exSortItemsAsc*/
var_Items = oG2antt.Items
	var_Items.AllowCellValueToItemBar = true
	var_Items.AddBar(var_Items.AddItem("Item 1"),"Task","12/04/2017","12/12/2017")
	var_Items.AddBar(var_Items.AddItem("Item 2"),"GTask","12/04/2017","12/12/2017")
	var_Items.AddBar(var_Items.AddItem("Item 3"),"RTask","12/04/2017","12/12/2017")
	var_Items.AddBar(var_Items.AddItem("Item 4"),"Task","12/04/2017","12/12/2017")
	var_Items.AddBar(var_Items.AddItem("Item 5"),"GTask","12/04/2017","12/12/2017")
	var_Items.AddBar(var_Items.AddItem("Item 6"),"RTask","12/04/2017","12/12/2017")
oG2antt.FilterBarFont = oG2antt.Font
oG2antt.Template = [Description(11) = FormatABC("`<fgcolor=808080> ` + value + ` </fgcolor>`",Description(11))] // oG2antt.Description(11) = Str(oG2antt.FormatABC("`<fgcolor=808080> ` + value + ` </fgcolor>`",oG2antt.Description(11)))
oG2antt.FilterBarCaption = "(( ( all replace `[<b>` with `<bgcolor=000000><fgcolor=FFFFFF><b> ` replace `</b>]` with ` </b></bgcolor></fgcolor>` replace `[<s>` with `<bgcolor=C0C0C0><fgcolor=FFFFFF> ` replace `</s>]` with ` </fgcolor></bgcolor>` )  + `<r><fgcolor=808080>` + ( matchitemcount < 0 ? ( ( len(value) ? `` : `` ) + `<r>` + abs(matchitemcount + 1) + ` result(s)` ) : (`<r><fgcolor=808080>`+ itemcount + ` item(s)`) )))"
oG2antt.FilterBarPromptVisible = 2579 /*exFilterBarCompact | exFilterBarShowCloseIfRequired | exFilterBarSingleLine | exFilterBarVisible | exFilterBarPromptVisible*/
var_Column2 = oG2antt.Columns.Item(1)
	var_Column2.FilterType = 240
	var_Column2.Filter = "GTask|RTask"
oG2antt.ApplyFilter()
oG2antt.EndUpdate()
|
|
2020
|
How can I display the control's filter bar in the Items section only, as it was displayed before
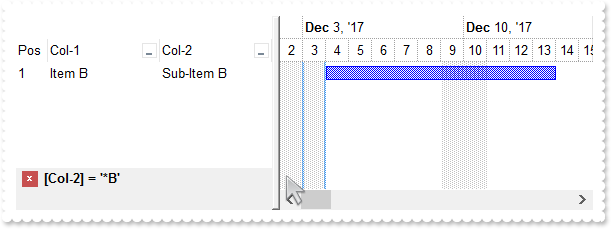
/*
with (this.EXG2ANTTCHARTACTIVEXCONTROL1.nativeObject)
	AddItem = class::nativeObject_AddItem
endwith
*/
// Occurs after a new Item has been inserted to Items collection.
function nativeObject_AddItem(Item)
	oG2antt = form.EXG2ANTTCHARTACTIVEXCONTROL1.nativeObject
	oG2antt.Items.AddBar(Item,"Task","12/04/2017","12/14/2017")
return

local oG2antt,var_Chart,var_Column,var_Column1,var_Column2,var_Column3,var_Items

oG2antt = form.EXG2ANTTCHARTACTIVEXCONTROL1.nativeObject
oG2antt.BeginUpdate()
var_Chart = oG2antt.Chart
	var_Chart.LevelCount = 2
	var_Chart.FirstVisibleDate = "12/02/2017"
	// var_Chart.PaneWidth(false) = 256
	with (oG2antt)
		TemplateDef = [dim var_Chart]
		TemplateDef = var_Chart
		Template = [var_Chart.PaneWidth(False) = 256]
	endwith
var_Column = oG2antt.Columns.Add("Col-1")
	var_Column.DisplayFilterButton = true
	var_Column.FilterList = 9504 /*exShowExclude | exShowFocusItem | exShowCheckBox | exSortItemsAsc*/
var_Column1 = oG2antt.Columns.Add("Col-2")
	var_Column1.DisplayFilterButton = true
	var_Column1.FilterList = 9504 /*exShowExclude | exShowFocusItem | exShowCheckBox | exSortItemsAsc*/
var_Column2 = oG2antt.Columns.Add("Pos")
	var_Column2.AllowSizing = false
	var_Column2.AllowSort = false
	var_Column2.Width = 32
	var_Column2.FormatColumn = "1 apos ``"
	var_Column2.Position = 0
var_Items = oG2antt.Items
	// var_Items.CellValue(var_Items.AddItem("Item A"),1) = "Sub-Item A"
	with (oG2antt)
		TemplateDef = [dim var_Items]
		TemplateDef = var_Items
		Template = [var_Items.CellValue(AddItem("Item A"),1) = "Sub-Item A"]
	endwith
	// var_Items.CellValue(var_Items.AddItem("Item B"),1) = "Sub-Item B"
	with (oG2antt)
		TemplateDef = [dim var_Items]
		TemplateDef = var_Items
		Template = [var_Items.CellValue(AddItem("Item B"),1) = "Sub-Item B"]
	endwith
	// var_Items.CellValue(var_Items.AddItem("Item C"),1) = "Sub-Item C"
	with (oG2antt)
		TemplateDef = [dim var_Items]
		TemplateDef = var_Items
		Template = [var_Items.CellValue(AddItem("Item C"),1) = "Sub-Item C"]
	endwith
oG2antt.FilterBarPromptVisible = 4096
var_Column3 = oG2antt.Columns.Item(1)
	var_Column3.FilterType = 3
	var_Column3.Filter = "*B"
oG2antt.ApplyFilter()
oG2antt.EndUpdate()
|
|
2019
|
FilterBarCaption ALL Keyword ( sample 2, result )
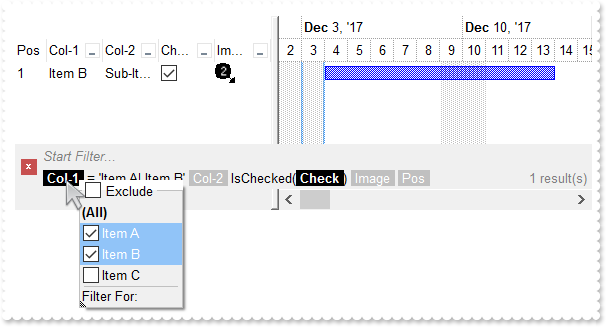
/*
with (this.EXG2ANTTCHARTACTIVEXCONTROL1.nativeObject)
	AddItem = class::nativeObject_AddItem
endwith
*/
// Occurs after a new Item has been inserted to Items collection.
function nativeObject_AddItem(Item)
	local i,var_Items
	oG2antt = form.EXG2ANTTCHARTACTIVEXCONTROL1.nativeObject
	i = oG2antt.FormatABC("value + 1",oG2antt.Items.ItemToIndex(Item))
	// oG2antt.Items.CellImage(Item,3) = i
	var_Items = oG2antt.Items
	with (oG2antt)
		TemplateDef = [dim var_Items]
		TemplateDef = var_Items
		Template = [var_Items.CellImage(Item,3) = i]
	endwith
	oG2antt.Items.AddBar(Item,"Task","12/04/2017","12/14/2017")
return

local h,oG2antt,var_Chart,var_Column,var_Column1,var_Column2,var_Column3,var_Column4,var_Column5,var_Editor,var_Items

oG2antt = form.EXG2ANTTCHARTACTIVEXCONTROL1.nativeObject
oG2antt.BeginUpdate()
var_Chart = oG2antt.Chart
	var_Chart.LevelCount = 2
	var_Chart.FirstVisibleDate = "12/02/2017"
	// var_Chart.PaneWidth(false) = 256
	with (oG2antt)
		TemplateDef = [dim var_Chart]
		TemplateDef = var_Chart
		Template = [var_Chart.PaneWidth(False) = 256]
	endwith
oG2antt.Images("gBJJgBAIDAAGAAEAAQhYAf8Pf4hh0QihCJo2AEZjQAjEZFEaIEaEEaAIAkcbk0olUrlktl0vmExmUzmk1m03nE5nU7nk9n0/oFBoVDolFo1HpFJpVLplNp1PqFRqVTqlVq1XrFZrVbrldr1fsFhsVjslls1ntFptVrtltt1vuFxuVzul1u13vF5vV7vl9v1/wGBwWDwmFw2HxGJxWLxmNx0xiFdyOTh8Tf9ZymXx+QytcyNgz8r0OblWjyWds+m0ka1Vf1ta1+r1mos2xrG2xeZ0+a0W0qOx3GO4NV3WeyvD2XJ5XL5nN51aiw+lfSj0gkUkAEllHanHI5j/cHg8EZf7w8vl8j4f/qfEZeB09/vjLAB30+kZQAP/P5/H6/yNAOAEAwCjMBwFAEDwJBMDwLBYAP2/8Hv8/gAGAD8LQs9w/nhDY/oygIA=")
var_Column = oG2antt.Columns.Add("Col-1")
	var_Column.DisplayFilterButton = true
	var_Column.FilterList = 9504 /*exShowExclude | exShowFocusItem | exShowCheckBox | exSortItemsAsc*/
var_Column1 = oG2antt.Columns.Add("Col-2")
	var_Column1.DisplayFilterButton = true
	var_Column1.FilterList = 9504 /*exShowExclude | exShowFocusItem | exShowCheckBox | exSortItemsAsc*/
var_Column2 = oG2antt.Columns.Add("Check")
	var_Editor = var_Column2.Editor
		var_Editor.EditType = 19
		// var_Editor.Option(17) = 1
		with (oG2antt)
			TemplateDef = [dim var_Editor]
			TemplateDef = var_Editor
			Template = [var_Editor.Option(17) = 1]
		endwith
	var_Column2.DisplayFilterButton = true
	var_Column2.DisplayFilterPattern = false
	var_Column2.FilterType = 6
var_Column3 = oG2antt.Columns.Add("Image")
	var_Column3.DisplayFilterButton = true
	var_Column3.FilterType = 10
	var_Column3.FilterList = 9472 /*exShowExclude | exShowFocusItem | exShowCheckBox*/
var_Column4 = oG2antt.Columns.Add("Pos")
	var_Column4.AllowSizing = false
	var_Column4.AllowSort = false
	var_Column4.Width = 32
	var_Column4.FormatColumn = "1 apos ``"
	var_Column4.Position = 0
var_Items = oG2antt.Items
	// var_Items.CellValue(var_Items.AddItem("Item A"),1) = "Sub-Item A"
	with (oG2antt)
		TemplateDef = [dim var_Items]
		TemplateDef = var_Items
		Template = [var_Items.CellValue(AddItem("Item A"),1) = "Sub-Item A"]
	endwith
	h = var_Items.AddItem("Item B")
	// var_Items.CellValue(h,1) = "Sub-Item B"
	with (oG2antt)
		TemplateDef = [dim var_Items,h]
		TemplateDef = var_Items
		TemplateDef = h
		Template = [var_Items.CellValue(h,1) = "Sub-Item B"]
	endwith
	// var_Items.CellState(h,2) = 1
	with (oG2antt)
		TemplateDef = [dim var_Items,h]
		TemplateDef = var_Items
		TemplateDef = h
		Template = [var_Items.CellState(h,2) = 1]
	endwith
	// var_Items.CellValue(var_Items.AddItem("Item C"),1) = "Sub-Item C"
	with (oG2antt)
		TemplateDef = [dim var_Items]
		TemplateDef = var_Items
		Template = [var_Items.CellValue(AddItem("Item C"),1) = "Sub-Item C"]
	endwith
oG2antt.FilterBarFont = oG2antt.Font
oG2antt.Template = [Description(11) = FormatABC("`<fgcolor=808080> ` + value + ` </fgcolor>`",Description(11))] // oG2antt.Description(11) = Str(oG2antt.FormatABC("`<fgcolor=808080> ` + value + ` </fgcolor>`",oG2antt.Description(11)))
oG2antt.FilterBarCaption = "(( ( all replace `[<b>` with `<bgcolor=000000><fgcolor=FFFFFF><b> ` replace `</b>]` with ` </b></bgcolor></fgcolor>` replace `[<s>` with `<bgcolor=C0C0C0><fgcolor=FFFFFF> ` replace `</s>]` with ` </fgcolor></bgcolor>` )  + `<r><fgcolor=808080>` + ( matchitemcount < 0 ? ( ( len(value) ? `` : `` ) + `<r>` + abs(matchitemcount + 1) + ` result(s)` ) : (`<r><fgcolor=808080>`+ itemcount + ` item(s)`) )))"
oG2antt.FilterBarPromptVisible = 3 /*exFilterBarVisible | exFilterBarPromptVisible*/
var_Column5 = oG2antt.Columns.Item(0)
	var_Column5.FilterType = 240
	var_Column5.Filter = "Item A|Item B"
oG2antt.Columns.Item(2).Filter = Str(1)
oG2antt.ApplyFilter()
oG2antt.EndUpdate()
|
|
2018
|
FilterBarCaption ALL Keyword ( sample 1 )
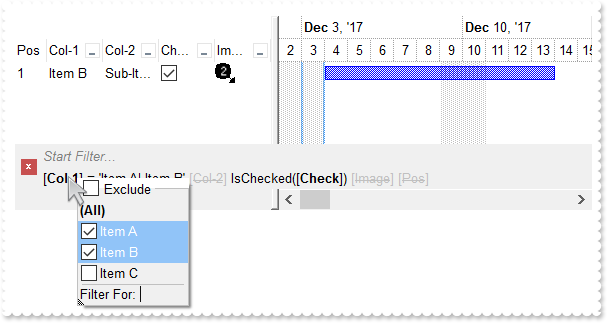
/*
with (this.EXG2ANTTCHARTACTIVEXCONTROL1.nativeObject)
	AddItem = class::nativeObject_AddItem
endwith
*/
// Occurs after a new Item has been inserted to Items collection.
function nativeObject_AddItem(Item)
	local i,var_Items
	oG2antt = form.EXG2ANTTCHARTACTIVEXCONTROL1.nativeObject
	i = oG2antt.FormatABC("value + 1",oG2antt.Items.ItemToIndex(Item))
	// oG2antt.Items.CellImage(Item,3) = i
	var_Items = oG2antt.Items
	with (oG2antt)
		TemplateDef = [dim var_Items]
		TemplateDef = var_Items
		Template = [var_Items.CellImage(Item,3) = i]
	endwith
	oG2antt.Items.AddBar(Item,"Task","12/04/2017","12/14/2017")
return

local h,oG2antt,var_Chart,var_Column,var_Column1,var_Column2,var_Column3,var_Column4,var_Column5,var_Editor,var_Items

oG2antt = form.EXG2ANTTCHARTACTIVEXCONTROL1.nativeObject
oG2antt.BeginUpdate()
var_Chart = oG2antt.Chart
	var_Chart.LevelCount = 2
	var_Chart.FirstVisibleDate = "12/02/2017"
	// var_Chart.PaneWidth(false) = 256
	with (oG2antt)
		TemplateDef = [dim var_Chart]
		TemplateDef = var_Chart
		Template = [var_Chart.PaneWidth(False) = 256]
	endwith
oG2antt.Images("gBJJgBAIDAAGAAEAAQhYAf8Pf4hh0QihCJo2AEZjQAjEZFEaIEaEEaAIAkcbk0olUrlktl0vmExmUzmk1m03nE5nU7nk9n0/oFBoVDolFo1HpFJpVLplNp1PqFRqVTqlVq1XrFZrVbrldr1fsFhsVjslls1ntFptVrtltt1vuFxuVzul1u13vF5vV7vl9v1/wGBwWDwmFw2HxGJxWLxmNx0xiFdyOTh8Tf9ZymXx+QytcyNgz8r0OblWjyWds+m0ka1Vf1ta1+r1mos2xrG2xeZ0+a0W0qOx3GO4NV3WeyvD2XJ5XL5nN51aiw+lfSj0gkUkAEllHanHI5j/cHg8EZf7w8vl8j4f/qfEZeB09/vjLAB30+kZQAP/P5/H6/yNAOAEAwCjMBwFAEDwJBMDwLBYAP2/8Hv8/gAGAD8LQs9w/nhDY/oygIA=")
var_Column = oG2antt.Columns.Add("Col-1")
	var_Column.DisplayFilterButton = true
	var_Column.FilterList = 9504 /*exShowExclude | exShowFocusItem | exShowCheckBox | exSortItemsAsc*/
var_Column1 = oG2antt.Columns.Add("Col-2")
	var_Column1.DisplayFilterButton = true
	var_Column1.FilterList = 9504 /*exShowExclude | exShowFocusItem | exShowCheckBox | exSortItemsAsc*/
var_Column2 = oG2antt.Columns.Add("Check")
	var_Editor = var_Column2.Editor
		var_Editor.EditType = 19
		// var_Editor.Option(17) = 1
		with (oG2antt)
			TemplateDef = [dim var_Editor]
			TemplateDef = var_Editor
			Template = [var_Editor.Option(17) = 1]
		endwith
	var_Column2.DisplayFilterButton = true
	var_Column2.DisplayFilterPattern = false
	var_Column2.FilterType = 6
var_Column3 = oG2antt.Columns.Add("Image")
	var_Column3.DisplayFilterButton = true
	var_Column3.FilterType = 10
	var_Column3.FilterList = 9472 /*exShowExclude | exShowFocusItem | exShowCheckBox*/
var_Column4 = oG2antt.Columns.Add("Pos")
	var_Column4.AllowSizing = false
	var_Column4.AllowSort = false
	var_Column4.Width = 32
	var_Column4.FormatColumn = "1 apos ``"
	var_Column4.Position = 0
var_Items = oG2antt.Items
	// var_Items.CellValue(var_Items.AddItem("Item A"),1) = "Sub-Item A"
	with (oG2antt)
		TemplateDef = [dim var_Items]
		TemplateDef = var_Items
		Template = [var_Items.CellValue(AddItem("Item A"),1) = "Sub-Item A"]
	endwith
	h = var_Items.AddItem("Item B")
	// var_Items.CellValue(h,1) = "Sub-Item B"
	with (oG2antt)
		TemplateDef = [dim var_Items,h]
		TemplateDef = var_Items
		TemplateDef = h
		Template = [var_Items.CellValue(h,1) = "Sub-Item B"]
	endwith
	// var_Items.CellState(h,2) = 1
	with (oG2antt)
		TemplateDef = [dim var_Items,h]
		TemplateDef = var_Items
		TemplateDef = h
		Template = [var_Items.CellState(h,2) = 1]
	endwith
	// var_Items.CellValue(var_Items.AddItem("Item C"),1) = "Sub-Item C"
	with (oG2antt)
		TemplateDef = [dim var_Items]
		TemplateDef = var_Items
		Template = [var_Items.CellValue(AddItem("Item C"),1) = "Sub-Item C"]
	endwith
oG2antt.FilterBarFont = oG2antt.Font
oG2antt.Template = [Description(11) = FormatABC("`<fgcolor=808080> ` + value + ` </fgcolor>`",Description(11))] // oG2antt.Description(11) = Str(oG2antt.FormatABC("`<fgcolor=808080> ` + value + ` </fgcolor>`",oG2antt.Description(11)))
oG2antt.FilterBarCaption = "all"
oG2antt.FilterBarPromptVisible = 3 /*exFilterBarVisible | exFilterBarPromptVisible*/
var_Column5 = oG2antt.Columns.Item(0)
	var_Column5.FilterType = 240
	var_Column5.Filter = "Item A|Item B"
oG2antt.Columns.Item(2).Filter = Str(1)
oG2antt.ApplyFilter()
oG2antt.EndUpdate()
|
|
2017
|
FilterBarCaption ALLUI Keyword ( sample 2, result )
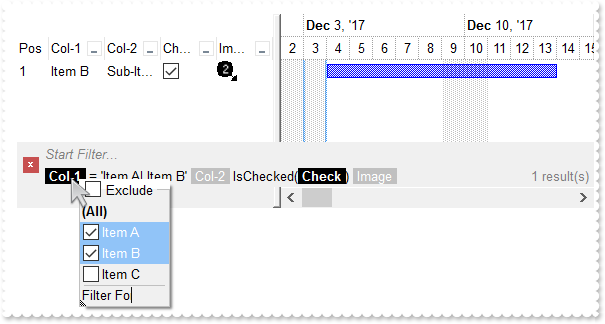
/*
with (this.EXG2ANTTCHARTACTIVEXCONTROL1.nativeObject)
	AddItem = class::nativeObject_AddItem
endwith
*/
// Occurs after a new Item has been inserted to Items collection.
function nativeObject_AddItem(Item)
	local i,var_Items
	oG2antt = form.EXG2ANTTCHARTACTIVEXCONTROL1.nativeObject
	i = oG2antt.FormatABC("value + 1",oG2antt.Items.ItemToIndex(Item))
	// oG2antt.Items.CellImage(Item,3) = i
	var_Items = oG2antt.Items
	with (oG2antt)
		TemplateDef = [dim var_Items]
		TemplateDef = var_Items
		Template = [var_Items.CellImage(Item,3) = i]
	endwith
	oG2antt.Items.AddBar(Item,"Task","12/04/2017","12/14/2017")
return

local h,oG2antt,var_Chart,var_Column,var_Column1,var_Column2,var_Column3,var_Column4,var_Column5,var_Editor,var_Items

oG2antt = form.EXG2ANTTCHARTACTIVEXCONTROL1.nativeObject
oG2antt.BeginUpdate()
var_Chart = oG2antt.Chart
	var_Chart.LevelCount = 2
	var_Chart.FirstVisibleDate = "12/02/2017"
	// var_Chart.PaneWidth(false) = 256
	with (oG2antt)
		TemplateDef = [dim var_Chart]
		TemplateDef = var_Chart
		Template = [var_Chart.PaneWidth(False) = 256]
	endwith
oG2antt.Images("gBJJgBAIDAAGAAEAAQhYAf8Pf4hh0QihCJo2AEZjQAjEZFEaIEaEEaAIAkcbk0olUrlktl0vmExmUzmk1m03nE5nU7nk9n0/oFBoVDolFo1HpFJpVLplNp1PqFRqVTqlVq1XrFZrVbrldr1fsFhsVjslls1ntFptVrtltt1vuFxuVzul1u13vF5vV7vl9v1/wGBwWDwmFw2HxGJxWLxmNx0xiFdyOTh8Tf9ZymXx+QytcyNgz8r0OblWjyWds+m0ka1Vf1ta1+r1mos2xrG2xeZ0+a0W0qOx3GO4NV3WeyvD2XJ5XL5nN51aiw+lfSj0gkUkAEllHanHI5j/cHg8EZf7w8vl8j4f/qfEZeB09/vjLAB30+kZQAP/P5/H6/yNAOAEAwCjMBwFAEDwJBMDwLBYAP2/8Hv8/gAGAD8LQs9w/nhDY/oygIA=")
var_Column = oG2antt.Columns.Add("Col-1")
	var_Column.DisplayFilterButton = true
	var_Column.FilterList = 9504 /*exShowExclude | exShowFocusItem | exShowCheckBox | exSortItemsAsc*/
var_Column1 = oG2antt.Columns.Add("Col-2")
	var_Column1.DisplayFilterButton = true
	var_Column1.FilterList = 9504 /*exShowExclude | exShowFocusItem | exShowCheckBox | exSortItemsAsc*/
var_Column2 = oG2antt.Columns.Add("Check")
	var_Editor = var_Column2.Editor
		var_Editor.EditType = 19
		// var_Editor.Option(17) = 1
		with (oG2antt)
			TemplateDef = [dim var_Editor]
			TemplateDef = var_Editor
			Template = [var_Editor.Option(17) = 1]
		endwith
	var_Column2.DisplayFilterButton = true
	var_Column2.DisplayFilterPattern = false
	var_Column2.FilterType = 6
var_Column3 = oG2antt.Columns.Add("Image")
	var_Column3.DisplayFilterButton = true
	var_Column3.FilterType = 10
	var_Column3.FilterList = 9472 /*exShowExclude | exShowFocusItem | exShowCheckBox*/
var_Column4 = oG2antt.Columns.Add("Pos")
	var_Column4.AllowSizing = false
	var_Column4.AllowSort = false
	var_Column4.Width = 32
	var_Column4.FormatColumn = "1 apos ``"
	var_Column4.Position = 0
var_Items = oG2antt.Items
	// var_Items.CellValue(var_Items.AddItem("Item A"),1) = "Sub-Item A"
	with (oG2antt)
		TemplateDef = [dim var_Items]
		TemplateDef = var_Items
		Template = [var_Items.CellValue(AddItem("Item A"),1) = "Sub-Item A"]
	endwith
	h = var_Items.AddItem("Item B")
	// var_Items.CellValue(h,1) = "Sub-Item B"
	with (oG2antt)
		TemplateDef = [dim var_Items,h]
		TemplateDef = var_Items
		TemplateDef = h
		Template = [var_Items.CellValue(h,1) = "Sub-Item B"]
	endwith
	// var_Items.CellState(h,2) = 1
	with (oG2antt)
		TemplateDef = [dim var_Items,h]
		TemplateDef = var_Items
		TemplateDef = h
		Template = [var_Items.CellState(h,2) = 1]
	endwith
	// var_Items.CellValue(var_Items.AddItem("Item C"),1) = "Sub-Item C"
	with (oG2antt)
		TemplateDef = [dim var_Items]
		TemplateDef = var_Items
		Template = [var_Items.CellValue(AddItem("Item C"),1) = "Sub-Item C"]
	endwith
oG2antt.FilterBarFont = oG2antt.Font
oG2antt.Template = [Description(11) = FormatABC("`<fgcolor=808080> ` + value + ` </fgcolor>`",Description(11))] // oG2antt.Description(11) = Str(oG2antt.FormatABC("`<fgcolor=808080> ` + value + ` </fgcolor>`",oG2antt.Description(11)))
oG2antt.FilterBarCaption = "(( ( allui replace `[<b>` with `<bgcolor=000000><fgcolor=FFFFFF><b> ` replace `</b>]` with ` </b></bgcolor></fgcolor>` replace `[<s>` with `<bgcolor=C0C0C0><fgcolor=FFFFFF> ` replace `</s>]` with ` </fgcolor></bgcolor>` )  + `<r><fgcolor=808080>` + ( matchitemcount < 0 ? ( ( len(value) ? `` : `` ) + `<r>` + abs(matchitemcount + 1) + ` result(s)` ) : (`<r><fgcolor=808080>`+ itemcount + ` item(s)`) )))"
oG2antt.FilterBarPromptVisible = 3 /*exFilterBarVisible | exFilterBarPromptVisible*/
var_Column5 = oG2antt.Columns.Item(0)
	var_Column5.FilterType = 240
	var_Column5.Filter = "Item A|Item B"
oG2antt.Columns.Item(2).Filter = Str(1)
oG2antt.ApplyFilter()
oG2antt.EndUpdate()
|
|
2016
|
FilterBarCaption ALLUI Keyword ( sample 1 )
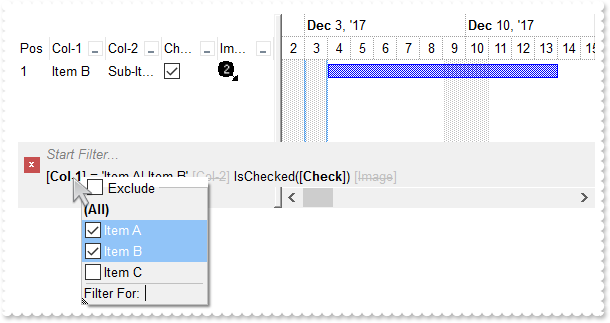
/*
with (this.EXG2ANTTCHARTACTIVEXCONTROL1.nativeObject)
	AddItem = class::nativeObject_AddItem
endwith
*/
// Occurs after a new Item has been inserted to Items collection.
function nativeObject_AddItem(Item)
	local i,var_Items
	oG2antt = form.EXG2ANTTCHARTACTIVEXCONTROL1.nativeObject
	i = oG2antt.FormatABC("value + 1",oG2antt.Items.ItemToIndex(Item))
	// oG2antt.Items.CellImage(Item,3) = i
	var_Items = oG2antt.Items
	with (oG2antt)
		TemplateDef = [dim var_Items]
		TemplateDef = var_Items
		Template = [var_Items.CellImage(Item,3) = i]
	endwith
	oG2antt.Items.AddBar(Item,"Task","12/04/2017","12/14/2017")
return

local h,oG2antt,var_Chart,var_Column,var_Column1,var_Column2,var_Column3,var_Column4,var_Column5,var_Editor,var_Items

oG2antt = form.EXG2ANTTCHARTACTIVEXCONTROL1.nativeObject
oG2antt.BeginUpdate()
var_Chart = oG2antt.Chart
	var_Chart.LevelCount = 2
	var_Chart.FirstVisibleDate = "12/02/2017"
	// var_Chart.PaneWidth(false) = 256
	with (oG2antt)
		TemplateDef = [dim var_Chart]
		TemplateDef = var_Chart
		Template = [var_Chart.PaneWidth(False) = 256]
	endwith
oG2antt.Images("gBJJgBAIDAAGAAEAAQhYAf8Pf4hh0QihCJo2AEZjQAjEZFEaIEaEEaAIAkcbk0olUrlktl0vmExmUzmk1m03nE5nU7nk9n0/oFBoVDolFo1HpFJpVLplNp1PqFRqVTqlVq1XrFZrVbrldr1fsFhsVjslls1ntFptVrtltt1vuFxuVzul1u13vF5vV7vl9v1/wGBwWDwmFw2HxGJxWLxmNx0xiFdyOTh8Tf9ZymXx+QytcyNgz8r0OblWjyWds+m0ka1Vf1ta1+r1mos2xrG2xeZ0+a0W0qOx3GO4NV3WeyvD2XJ5XL5nN51aiw+lfSj0gkUkAEllHanHI5j/cHg8EZf7w8vl8j4f/qfEZeB09/vjLAB30+kZQAP/P5/H6/yNAOAEAwCjMBwFAEDwJBMDwLBYAP2/8Hv8/gAGAD8LQs9w/nhDY/oygIA=")
var_Column = oG2antt.Columns.Add("Col-1")
	var_Column.DisplayFilterButton = true
	var_Column.FilterList = 9504 /*exShowExclude | exShowFocusItem | exShowCheckBox | exSortItemsAsc*/
var_Column1 = oG2antt.Columns.Add("Col-2")
	var_Column1.DisplayFilterButton = true
	var_Column1.FilterList = 9504 /*exShowExclude | exShowFocusItem | exShowCheckBox | exSortItemsAsc*/
var_Column2 = oG2antt.Columns.Add("Check")
	var_Editor = var_Column2.Editor
		var_Editor.EditType = 19
		// var_Editor.Option(17) = 1
		with (oG2antt)
			TemplateDef = [dim var_Editor]
			TemplateDef = var_Editor
			Template = [var_Editor.Option(17) = 1]
		endwith
	var_Column2.DisplayFilterButton = true
	var_Column2.DisplayFilterPattern = false
	var_Column2.FilterType = 6
var_Column3 = oG2antt.Columns.Add("Image")
	var_Column3.DisplayFilterButton = true
	var_Column3.FilterType = 10
	var_Column3.FilterList = 9472 /*exShowExclude | exShowFocusItem | exShowCheckBox*/
var_Column4 = oG2antt.Columns.Add("Pos")
	var_Column4.AllowSizing = false
	var_Column4.AllowSort = false
	var_Column4.Width = 32
	var_Column4.FormatColumn = "1 apos ``"
	var_Column4.Position = 0
var_Items = oG2antt.Items
	// var_Items.CellValue(var_Items.AddItem("Item A"),1) = "Sub-Item A"
	with (oG2antt)
		TemplateDef = [dim var_Items]
		TemplateDef = var_Items
		Template = [var_Items.CellValue(AddItem("Item A"),1) = "Sub-Item A"]
	endwith
	h = var_Items.AddItem("Item B")
	// var_Items.CellValue(h,1) = "Sub-Item B"
	with (oG2antt)
		TemplateDef = [dim var_Items,h]
		TemplateDef = var_Items
		TemplateDef = h
		Template = [var_Items.CellValue(h,1) = "Sub-Item B"]
	endwith
	// var_Items.CellState(h,2) = 1
	with (oG2antt)
		TemplateDef = [dim var_Items,h]
		TemplateDef = var_Items
		TemplateDef = h
		Template = [var_Items.CellState(h,2) = 1]
	endwith
	// var_Items.CellValue(var_Items.AddItem("Item C"),1) = "Sub-Item C"
	with (oG2antt)
		TemplateDef = [dim var_Items]
		TemplateDef = var_Items
		Template = [var_Items.CellValue(AddItem("Item C"),1) = "Sub-Item C"]
	endwith
oG2antt.FilterBarFont = oG2antt.Font
oG2antt.Template = [Description(11) = FormatABC("`<fgcolor=808080> ` + value + ` </fgcolor>`",Description(11))] // oG2antt.Description(11) = Str(oG2antt.FormatABC("`<fgcolor=808080> ` + value + ` </fgcolor>`",oG2antt.Description(11)))
oG2antt.FilterBarCaption = "allui"
oG2antt.FilterBarPromptVisible = 3 /*exFilterBarVisible | exFilterBarPromptVisible*/
var_Column5 = oG2antt.Columns.Item(0)
	var_Column5.FilterType = 240
	var_Column5.Filter = "Item A|Item B"
oG2antt.Columns.Item(2).Filter = Str(1)
oG2antt.ApplyFilter()
oG2antt.EndUpdate()
|
|
2015
|
FilterBarCaption AVAILABLE Keyword ( sample 2, result )
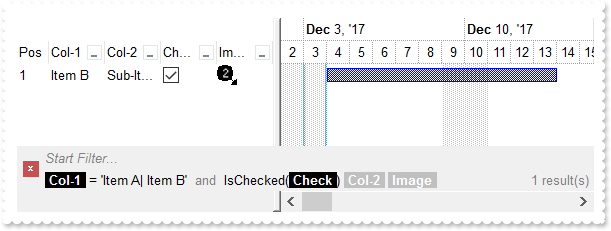
/*
with (this.EXG2ANTTCHARTACTIVEXCONTROL1.nativeObject)
	AddItem = class::nativeObject_AddItem
endwith
*/
// Occurs after a new Item has been inserted to Items collection.
function nativeObject_AddItem(Item)
	local i,var_Items
	oG2antt = form.EXG2ANTTCHARTACTIVEXCONTROL1.nativeObject
	i = oG2antt.FormatABC("value + 1",oG2antt.Items.ItemToIndex(Item))
	// oG2antt.Items.CellImage(Item,3) = i
	var_Items = oG2antt.Items
	with (oG2antt)
		TemplateDef = [dim var_Items]
		TemplateDef = var_Items
		Template = [var_Items.CellImage(Item,3) = i]
	endwith
	oG2antt.Items.AddBar(Item,"Task","12/04/2017","12/14/2017")
return

local h,oG2antt,var_Chart,var_Column,var_Column1,var_Column2,var_Column3,var_Column4,var_Column5,var_Editor,var_Items

oG2antt = form.EXG2ANTTCHARTACTIVEXCONTROL1.nativeObject
oG2antt.BeginUpdate()
var_Chart = oG2antt.Chart
	var_Chart.LevelCount = 2
	var_Chart.FirstVisibleDate = "12/02/2017"
	// var_Chart.PaneWidth(false) = 256
	with (oG2antt)
		TemplateDef = [dim var_Chart]
		TemplateDef = var_Chart
		Template = [var_Chart.PaneWidth(False) = 256]
	endwith
oG2antt.Images("gBJJgBAIDAAGAAEAAQhYAf8Pf4hh0QihCJo2AEZjQAjEZFEaIEaEEaAIAkcbk0olUrlktl0vmExmUzmk1m03nE5nU7nk9n0/oFBoVDolFo1HpFJpVLplNp1PqFRqVTqlVq1XrFZrVbrldr1fsFhsVjslls1ntFptVrtltt1vuFxuVzul1u13vF5vV7vl9v1/wGBwWDwmFw2HxGJxWLxmNx0xiFdyOTh8Tf9ZymXx+QytcyNgz8r0OblWjyWds+m0ka1Vf1ta1+r1mos2xrG2xeZ0+a0W0qOx3GO4NV3WeyvD2XJ5XL5nN51aiw+lfSj0gkUkAEllHanHI5j/cHg8EZf7w8vl8j4f/qfEZeB09/vjLAB30+kZQAP/P5/H6/yNAOAEAwCjMBwFAEDwJBMDwLBYAP2/8Hv8/gAGAD8LQs9w/nhDY/oygIA=")
var_Column = oG2antt.Columns.Add("Col-1")
	var_Column.DisplayFilterButton = true
	var_Column.FilterList = 9504 /*exShowExclude | exShowFocusItem | exShowCheckBox | exSortItemsAsc*/
var_Column1 = oG2antt.Columns.Add("Col-2")
	var_Column1.DisplayFilterButton = true
	var_Column1.FilterList = 9504 /*exShowExclude | exShowFocusItem | exShowCheckBox | exSortItemsAsc*/
var_Column2 = oG2antt.Columns.Add("Check")
	var_Editor = var_Column2.Editor
		var_Editor.EditType = 19
		// var_Editor.Option(17) = 1
		with (oG2antt)
			TemplateDef = [dim var_Editor]
			TemplateDef = var_Editor
			Template = [var_Editor.Option(17) = 1]
		endwith
	var_Column2.DisplayFilterButton = true
	var_Column2.DisplayFilterPattern = false
	var_Column2.FilterType = 6
var_Column3 = oG2antt.Columns.Add("Image")
	var_Column3.DisplayFilterButton = true
	var_Column3.FilterType = 10
	var_Column3.FilterList = 9472 /*exShowExclude | exShowFocusItem | exShowCheckBox*/
var_Column4 = oG2antt.Columns.Add("Pos")
	var_Column4.AllowSizing = false
	var_Column4.AllowSort = false
	var_Column4.Width = 32
	var_Column4.FormatColumn = "1 apos ``"
	var_Column4.Position = 0
var_Items = oG2antt.Items
	// var_Items.CellValue(var_Items.AddItem("Item A"),1) = "Sub-Item A"
	with (oG2antt)
		TemplateDef = [dim var_Items]
		TemplateDef = var_Items
		Template = [var_Items.CellValue(AddItem("Item A"),1) = "Sub-Item A"]
	endwith
	h = var_Items.AddItem("Item B")
	// var_Items.CellValue(h,1) = "Sub-Item B"
	with (oG2antt)
		TemplateDef = [dim var_Items,h]
		TemplateDef = var_Items
		TemplateDef = h
		Template = [var_Items.CellValue(h,1) = "Sub-Item B"]
	endwith
	// var_Items.CellState(h,2) = 1
	with (oG2antt)
		TemplateDef = [dim var_Items,h]
		TemplateDef = var_Items
		TemplateDef = h
		Template = [var_Items.CellState(h,2) = 1]
	endwith
	// var_Items.CellValue(var_Items.AddItem("Item C"),1) = "Sub-Item C"
	with (oG2antt)
		TemplateDef = [dim var_Items]
		TemplateDef = var_Items
		Template = [var_Items.CellValue(AddItem("Item C"),1) = "Sub-Item C"]
	endwith
oG2antt.FilterBarFont = oG2antt.Font
oG2antt.Template = [Description(11) = FormatABC("`<fgcolor=808080> ` + value + ` </fgcolor>`",Description(11))] // oG2antt.Description(11) = Str(oG2antt.FormatABC("`<fgcolor=808080> ` + value + ` </fgcolor>`",oG2antt.Description(11)))
oG2antt.FilterBarCaption = "(( ( value replace `[` with `<bgcolor=000000><fgcolor=FFFFFF><b> ` replace `]` with ` </b></bgcolor></fgcolor>` ) + ` ` + ( available replace `[` with `<bgcolor=C0C0C0><fgcolor=FFFFFF><b> ` replace `]` with ` </b></bgcolor></fgcolor>` replace `<s>` with `` replace `</s>` with `` ) + `<fgcolor=808080>` + ( matchitemcount < 0 ? ( ( len(value) ? `` : `` ) + `<r>` + abs(matchitemcount + 1) + ` result(s)` ) : (`<r><fgcolor=808080>`+ itemcount + ` item(s)`) )))"
oG2antt.FilterBarPromptVisible = 3 /*exFilterBarVisible | exFilterBarPromptVisible*/
var_Column5 = oG2antt.Columns.Item(0)
	var_Column5.FilterType = 240
	var_Column5.Filter = "Item A|Item B"
oG2antt.Columns.Item(2).Filter = Str(1)
oG2antt.ApplyFilter()
oG2antt.EndUpdate()
|
|
2014
|
FilterBarCaption AVAILABLE Keyword ( sample 1 )
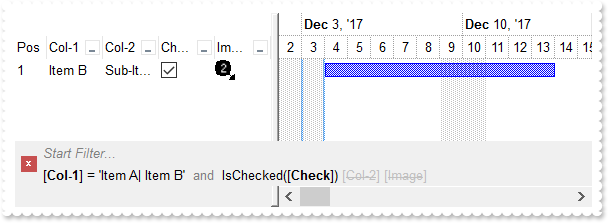
/*
with (this.EXG2ANTTCHARTACTIVEXCONTROL1.nativeObject)
	AddItem = class::nativeObject_AddItem
endwith
*/
// Occurs after a new Item has been inserted to Items collection.
function nativeObject_AddItem(Item)
	local i,var_Items
	oG2antt = form.EXG2ANTTCHARTACTIVEXCONTROL1.nativeObject
	i = oG2antt.FormatABC("value + 1",oG2antt.Items.ItemToIndex(Item))
	// oG2antt.Items.CellImage(Item,3) = i
	var_Items = oG2antt.Items
	with (oG2antt)
		TemplateDef = [dim var_Items]
		TemplateDef = var_Items
		Template = [var_Items.CellImage(Item,3) = i]
	endwith
	oG2antt.Items.AddBar(Item,"Task","12/04/2017","12/14/2017")
return

local h,oG2antt,var_Chart,var_Column,var_Column1,var_Column2,var_Column3,var_Column4,var_Column5,var_Editor,var_Items

oG2antt = form.EXG2ANTTCHARTACTIVEXCONTROL1.nativeObject
oG2antt.BeginUpdate()
var_Chart = oG2antt.Chart
	var_Chart.LevelCount = 2
	var_Chart.FirstVisibleDate = "12/02/2017"
	// var_Chart.PaneWidth(false) = 256
	with (oG2antt)
		TemplateDef = [dim var_Chart]
		TemplateDef = var_Chart
		Template = [var_Chart.PaneWidth(False) = 256]
	endwith
oG2antt.Images("gBJJgBAIDAAGAAEAAQhYAf8Pf4hh0QihCJo2AEZjQAjEZFEaIEaEEaAIAkcbk0olUrlktl0vmExmUzmk1m03nE5nU7nk9n0/oFBoVDolFo1HpFJpVLplNp1PqFRqVTqlVq1XrFZrVbrldr1fsFhsVjslls1ntFptVrtltt1vuFxuVzul1u13vF5vV7vl9v1/wGBwWDwmFw2HxGJxWLxmNx0xiFdyOTh8Tf9ZymXx+QytcyNgz8r0OblWjyWds+m0ka1Vf1ta1+r1mos2xrG2xeZ0+a0W0qOx3GO4NV3WeyvD2XJ5XL5nN51aiw+lfSj0gkUkAEllHanHI5j/cHg8EZf7w8vl8j4f/qfEZeB09/vjLAB30+kZQAP/P5/H6/yNAOAEAwCjMBwFAEDwJBMDwLBYAP2/8Hv8/gAGAD8LQs9w/nhDY/oygIA=")
var_Column = oG2antt.Columns.Add("Col-1")
	var_Column.DisplayFilterButton = true
	var_Column.FilterList = 9504 /*exShowExclude | exShowFocusItem | exShowCheckBox | exSortItemsAsc*/
var_Column1 = oG2antt.Columns.Add("Col-2")
	var_Column1.DisplayFilterButton = true
	var_Column1.FilterList = 9504 /*exShowExclude | exShowFocusItem | exShowCheckBox | exSortItemsAsc*/
var_Column2 = oG2antt.Columns.Add("Check")
	var_Editor = var_Column2.Editor
		var_Editor.EditType = 19
		// var_Editor.Option(17) = 1
		with (oG2antt)
			TemplateDef = [dim var_Editor]
			TemplateDef = var_Editor
			Template = [var_Editor.Option(17) = 1]
		endwith
	var_Column2.DisplayFilterButton = true
	var_Column2.DisplayFilterPattern = false
	var_Column2.FilterType = 6
var_Column3 = oG2antt.Columns.Add("Image")
	var_Column3.DisplayFilterButton = true
	var_Column3.FilterType = 10
	var_Column3.FilterList = 9472 /*exShowExclude | exShowFocusItem | exShowCheckBox*/
var_Column4 = oG2antt.Columns.Add("Pos")
	var_Column4.AllowSizing = false
	var_Column4.AllowSort = false
	var_Column4.Width = 32
	var_Column4.FormatColumn = "1 apos ``"
	var_Column4.Position = 0
var_Items = oG2antt.Items
	// var_Items.CellValue(var_Items.AddItem("Item A"),1) = "Sub-Item A"
	with (oG2antt)
		TemplateDef = [dim var_Items]
		TemplateDef = var_Items
		Template = [var_Items.CellValue(AddItem("Item A"),1) = "Sub-Item A"]
	endwith
	h = var_Items.AddItem("Item B")
	// var_Items.CellValue(h,1) = "Sub-Item B"
	with (oG2antt)
		TemplateDef = [dim var_Items,h]
		TemplateDef = var_Items
		TemplateDef = h
		Template = [var_Items.CellValue(h,1) = "Sub-Item B"]
	endwith
	// var_Items.CellState(h,2) = 1
	with (oG2antt)
		TemplateDef = [dim var_Items,h]
		TemplateDef = var_Items
		TemplateDef = h
		Template = [var_Items.CellState(h,2) = 1]
	endwith
	// var_Items.CellValue(var_Items.AddItem("Item C"),1) = "Sub-Item C"
	with (oG2antt)
		TemplateDef = [dim var_Items]
		TemplateDef = var_Items
		Template = [var_Items.CellValue(AddItem("Item C"),1) = "Sub-Item C"]
	endwith
oG2antt.FilterBarFont = oG2antt.Font
oG2antt.Template = [Description(11) = FormatABC("`<fgcolor=808080> ` + value + ` </fgcolor>`",Description(11))] // oG2antt.Description(11) = Str(oG2antt.FormatABC("`<fgcolor=808080> ` + value + ` </fgcolor>`",oG2antt.Description(11)))
oG2antt.FilterBarCaption = "value + ` ` + available"
oG2antt.FilterBarPromptVisible = 3 /*exFilterBarVisible | exFilterBarPromptVisible*/
var_Column5 = oG2antt.Columns.Item(0)
	var_Column5.FilterType = 240
	var_Column5.Filter = "Item A|Item B"
oG2antt.Columns.Item(2).Filter = Str(1)
oG2antt.ApplyFilter()
oG2antt.EndUpdate()
|
|
2013
|
Is it possible to somehow highlight the column's name different than its filter value in the control's filter bar ( sample 3, results )
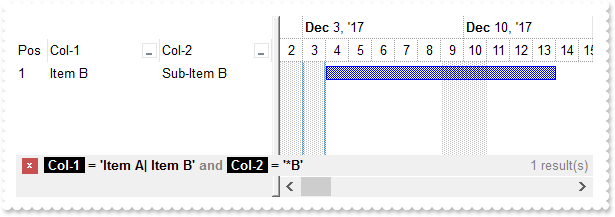
/*
with (this.EXG2ANTTCHARTACTIVEXCONTROL1.nativeObject)
	AddItem = class::nativeObject_AddItem
endwith
*/
// Occurs after a new Item has been inserted to Items collection.
function nativeObject_AddItem(Item)
	oG2antt = form.EXG2ANTTCHARTACTIVEXCONTROL1.nativeObject
	oG2antt.Items.AddBar(Item,"Task","12/04/2017","12/14/2017")
return

local oG2antt,var_Chart,var_Column,var_Column1,var_Column2,var_Column3,var_Column4,var_Items

oG2antt = form.EXG2ANTTCHARTACTIVEXCONTROL1.nativeObject
oG2antt.BeginUpdate()
var_Chart = oG2antt.Chart
	var_Chart.LevelCount = 2
	var_Chart.FirstVisibleDate = "12/02/2017"
	// var_Chart.PaneWidth(false) = 256
	with (oG2antt)
		TemplateDef = [dim var_Chart]
		TemplateDef = var_Chart
		Template = [var_Chart.PaneWidth(False) = 256]
	endwith
var_Column = oG2antt.Columns.Add("Col-1")
	var_Column.DisplayFilterButton = true
	var_Column.FilterList = 9504 /*exShowExclude | exShowFocusItem | exShowCheckBox | exSortItemsAsc*/
var_Column1 = oG2antt.Columns.Add("Col-2")
	var_Column1.DisplayFilterButton = true
	var_Column1.FilterList = 9504 /*exShowExclude | exShowFocusItem | exShowCheckBox | exSortItemsAsc*/
var_Column2 = oG2antt.Columns.Add("Pos")
	var_Column2.AllowSizing = false
	var_Column2.AllowSort = false
	var_Column2.Width = 32
	var_Column2.FormatColumn = "1 apos ``"
	var_Column2.Position = 0
var_Items = oG2antt.Items
	// var_Items.CellValue(var_Items.AddItem("Item A"),1) = "Sub-Item A"
	with (oG2antt)
		TemplateDef = [dim var_Items]
		TemplateDef = var_Items
		Template = [var_Items.CellValue(AddItem("Item A"),1) = "Sub-Item A"]
	endwith
	// var_Items.CellValue(var_Items.AddItem("Item B"),1) = "Sub-Item B"
	with (oG2antt)
		TemplateDef = [dim var_Items]
		TemplateDef = var_Items
		Template = [var_Items.CellValue(AddItem("Item B"),1) = "Sub-Item B"]
	endwith
	// var_Items.CellValue(var_Items.AddItem("Item C"),1) = "Sub-Item C"
	with (oG2antt)
		TemplateDef = [dim var_Items]
		TemplateDef = var_Items
		Template = [var_Items.CellValue(AddItem("Item C"),1) = "Sub-Item C"]
	endwith
oG2antt.FilterBarFont = oG2antt.Font
oG2antt.Template = [Description(11) = FormatABC("`<fgcolor=808080>` + value + `</fgcolor>`",Description(11))] // oG2antt.Description(11) = Str(oG2antt.FormatABC("`<fgcolor=808080>` + value + `</fgcolor>`",oG2antt.Description(11)))
oG2antt.FilterBarCaption = "(`<b>` + value + `</b><fgcolor=808080>` + ( matchitemcount < 0 ? ( ( len(value) ? `` : `` ) + `<r>` + abs(matchitemcount + 1) + ` result(s)` ) : (`<fgcolor=808080>`+ itemcount + ` item(s)`) )) replace `[` with `<bgcolor=000000><fgcolor=FFFFFF><b> ` replace `]` with ` </b></bgcolor></fgcolor>`"
oG2antt.FilterBarPromptVisible = 256
var_Column3 = oG2antt.Columns.Item(0)
	var_Column3.FilterType = 240
	var_Column3.Filter = "Item A|Item B"
var_Column4 = oG2antt.Columns.Item(1)
	var_Column4.FilterType = 3
	var_Column4.Filter = "*B"
oG2antt.ApplyFilter()
oG2antt.EndUpdate()
|
|
2012
|
Is it possible to somehow highlight the column's name different than its filter value in the control's filter bar ( sample 2 )
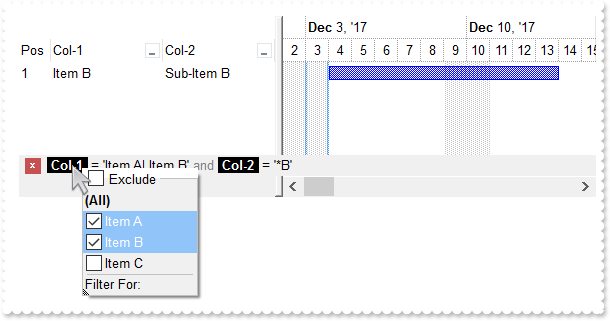
/*
with (this.EXG2ANTTCHARTACTIVEXCONTROL1.nativeObject)
	AddItem = class::nativeObject_AddItem
endwith
*/
// Occurs after a new Item has been inserted to Items collection.
function nativeObject_AddItem(Item)
	oG2antt = form.EXG2ANTTCHARTACTIVEXCONTROL1.nativeObject
	oG2antt.Items.AddBar(Item,"Task","12/04/2017","12/14/2017")
return

local oG2antt,var_Chart,var_Column,var_Column1,var_Column2,var_Column3,var_Column4,var_Items

oG2antt = form.EXG2ANTTCHARTACTIVEXCONTROL1.nativeObject
oG2antt.BeginUpdate()
var_Chart = oG2antt.Chart
	var_Chart.LevelCount = 2
	var_Chart.FirstVisibleDate = "12/02/2017"
	// var_Chart.PaneWidth(false) = 256
	with (oG2antt)
		TemplateDef = [dim var_Chart]
		TemplateDef = var_Chart
		Template = [var_Chart.PaneWidth(False) = 256]
	endwith
var_Column = oG2antt.Columns.Add("Col-1")
	var_Column.DisplayFilterButton = true
	var_Column.FilterList = 9504 /*exShowExclude | exShowFocusItem | exShowCheckBox | exSortItemsAsc*/
var_Column1 = oG2antt.Columns.Add("Col-2")
	var_Column1.DisplayFilterButton = true
	var_Column1.FilterList = 9504 /*exShowExclude | exShowFocusItem | exShowCheckBox | exSortItemsAsc*/
var_Column2 = oG2antt.Columns.Add("Pos")
	var_Column2.AllowSizing = false
	var_Column2.AllowSort = false
	var_Column2.Width = 32
	var_Column2.FormatColumn = "1 apos ``"
	var_Column2.Position = 0
var_Items = oG2antt.Items
	// var_Items.CellValue(var_Items.AddItem("Item A"),1) = "Sub-Item A"
	with (oG2antt)
		TemplateDef = [dim var_Items]
		TemplateDef = var_Items
		Template = [var_Items.CellValue(AddItem("Item A"),1) = "Sub-Item A"]
	endwith
	// var_Items.CellValue(var_Items.AddItem("Item B"),1) = "Sub-Item B"
	with (oG2antt)
		TemplateDef = [dim var_Items]
		TemplateDef = var_Items
		Template = [var_Items.CellValue(AddItem("Item B"),1) = "Sub-Item B"]
	endwith
	// var_Items.CellValue(var_Items.AddItem("Item C"),1) = "Sub-Item C"
	with (oG2antt)
		TemplateDef = [dim var_Items]
		TemplateDef = var_Items
		Template = [var_Items.CellValue(AddItem("Item C"),1) = "Sub-Item C"]
	endwith
oG2antt.FilterBarFont = oG2antt.Font
oG2antt.Template = [Description(11) = FormatABC("`<fgcolor=808080>` + value + `</fgcolor>`",Description(11))] // oG2antt.Description(11) = Str(oG2antt.FormatABC("`<fgcolor=808080>` + value + `</fgcolor>`",oG2antt.Description(11)))
oG2antt.FilterBarCaption = "value replace `[` with `<bgcolor=000000><fgcolor=FFFFFF><b> ` replace `]` with ` </b></bgcolor></fgcolor>`"
oG2antt.FilterBarPromptVisible = 256
var_Column3 = oG2antt.Columns.Item(0)
	var_Column3.FilterType = 240
	var_Column3.Filter = "Item A|Item B"
var_Column4 = oG2antt.Columns.Item(1)
	var_Column4.FilterType = 3
	var_Column4.Filter = "*B"
oG2antt.ApplyFilter()
oG2antt.EndUpdate()
|
|
2011
|
Is it possible to somehow highlight the column's name different than its filter value in the control's filter bar ( sample 1 )
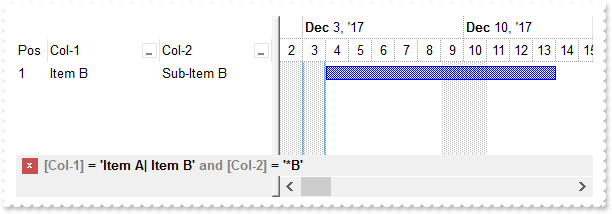
/*
with (this.EXG2ANTTCHARTACTIVEXCONTROL1.nativeObject)
	AddItem = class::nativeObject_AddItem
endwith
*/
// Occurs after a new Item has been inserted to Items collection.
function nativeObject_AddItem(Item)
	oG2antt = form.EXG2ANTTCHARTACTIVEXCONTROL1.nativeObject
	oG2antt.Items.AddBar(Item,"Task","12/04/2017","12/14/2017")
return

local oG2antt,var_Chart,var_Column,var_Column1,var_Column2,var_Column3,var_Column4,var_Items

oG2antt = form.EXG2ANTTCHARTACTIVEXCONTROL1.nativeObject
oG2antt.BeginUpdate()
var_Chart = oG2antt.Chart
	var_Chart.LevelCount = 2
	var_Chart.FirstVisibleDate = "12/02/2017"
	// var_Chart.PaneWidth(false) = 256
	with (oG2antt)
		TemplateDef = [dim var_Chart]
		TemplateDef = var_Chart
		Template = [var_Chart.PaneWidth(False) = 256]
	endwith
var_Column = oG2antt.Columns.Add("Col-1")
	var_Column.DisplayFilterButton = true
	var_Column.FilterList = 9504 /*exShowExclude | exShowFocusItem | exShowCheckBox | exSortItemsAsc*/
var_Column1 = oG2antt.Columns.Add("Col-2")
	var_Column1.DisplayFilterButton = true
	var_Column1.FilterList = 9504 /*exShowExclude | exShowFocusItem | exShowCheckBox | exSortItemsAsc*/
var_Column2 = oG2antt.Columns.Add("Pos")
	var_Column2.AllowSizing = false
	var_Column2.AllowSort = false
	var_Column2.Width = 32
	var_Column2.FormatColumn = "1 apos ``"
	var_Column2.Position = 0
var_Items = oG2antt.Items
	// var_Items.CellValue(var_Items.AddItem("Item A"),1) = "Sub-Item A"
	with (oG2antt)
		TemplateDef = [dim var_Items]
		TemplateDef = var_Items
		Template = [var_Items.CellValue(AddItem("Item A"),1) = "Sub-Item A"]
	endwith
	// var_Items.CellValue(var_Items.AddItem("Item B"),1) = "Sub-Item B"
	with (oG2antt)
		TemplateDef = [dim var_Items]
		TemplateDef = var_Items
		Template = [var_Items.CellValue(AddItem("Item B"),1) = "Sub-Item B"]
	endwith
	// var_Items.CellValue(var_Items.AddItem("Item C"),1) = "Sub-Item C"
	with (oG2antt)
		TemplateDef = [dim var_Items]
		TemplateDef = var_Items
		Template = [var_Items.CellValue(AddItem("Item C"),1) = "Sub-Item C"]
	endwith
oG2antt.Template = [Description(11) = FormatABC("`<fgcolor=808080>` + value + `</fgcolor>`",Description(11))] // oG2antt.Description(11) = Str(oG2antt.FormatABC("`<fgcolor=808080>` + value + `</fgcolor>`",oG2antt.Description(11)))
oG2antt.FilterBarCaption = "value replace `[` with `<fgcolor=808080>[` replace `]` with `]</fgcolor>`"
oG2antt.FilterBarPromptVisible = 256
var_Column3 = oG2antt.Columns.Item(0)
	var_Column3.FilterType = 240
	var_Column3.Filter = "Item A|Item B"
var_Column4 = oG2antt.Columns.Item(1)
	var_Column4.FilterType = 3
	var_Column4.Filter = "*B"
oG2antt.ApplyFilter()
oG2antt.EndUpdate()
|
|
2010
|
Is it possible to automatically displays the control's filter label to the right
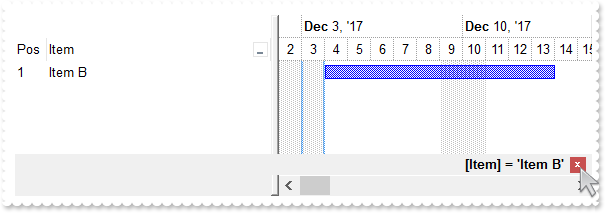
/*
with (this.EXG2ANTTCHARTACTIVEXCONTROL1.nativeObject)
	AddItem = class::nativeObject_AddItem
endwith
*/
// Occurs after a new Item has been inserted to Items collection.
function nativeObject_AddItem(Item)
	oG2antt = form.EXG2ANTTCHARTACTIVEXCONTROL1.nativeObject
	oG2antt.Items.AddBar(Item,"Task","12/04/2017","12/14/2017")
return

local oG2antt,var_Chart,var_Column,var_Column1,var_Column2,var_Items

oG2antt = form.EXG2ANTTCHARTACTIVEXCONTROL1.nativeObject
oG2antt.BeginUpdate()
var_Chart = oG2antt.Chart
	var_Chart.LevelCount = 2
	var_Chart.FirstVisibleDate = "12/02/2017"
	// var_Chart.PaneWidth(false) = 256
	with (oG2antt)
		TemplateDef = [dim var_Chart]
		TemplateDef = var_Chart
		Template = [var_Chart.PaneWidth(False) = 256]
	endwith
var_Column = oG2antt.Columns.Add("Item")
	var_Column.DisplayFilterButton = true
	var_Column.FilterList = 9504 /*exShowExclude | exShowFocusItem | exShowCheckBox | exSortItemsAsc*/
var_Column1 = oG2antt.Columns.Add("Pos")
	var_Column1.AllowSizing = false
	var_Column1.AllowSort = false
	var_Column1.Width = 32
	var_Column1.FormatColumn = "1 apos ``"
	var_Column1.Position = 0
var_Items = oG2antt.Items
	var_Items.AddItem("Item A")
	var_Items.AddItem("Item B")
	var_Items.AddItem("Item C")
oG2antt.FilterBarCaption = "`<r>` + value"
oG2antt.FilterBarPromptVisible = 1280 /*exFilterBarShowCloseOnRight | exFilterBarToggle*/
var_Column2 = oG2antt.Columns.Item(0)
	var_Column2.FilterType = 240
	var_Column2.Filter = "Item B"
oG2antt.ApplyFilter()
oG2antt.EndUpdate()
|
|
2009
|
How can I get the number of results/items being shown in the control's filter bar (sample 4)
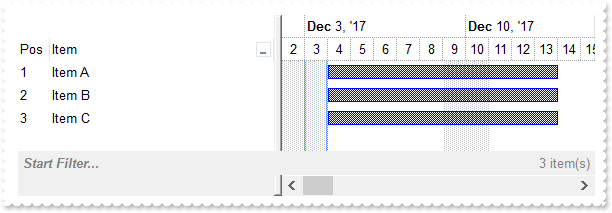
/*
with (this.EXG2ANTTCHARTACTIVEXCONTROL1.nativeObject)
	AddItem = class::nativeObject_AddItem
endwith
*/
// Occurs after a new Item has been inserted to Items collection.
function nativeObject_AddItem(Item)
	oG2antt = form.EXG2ANTTCHARTACTIVEXCONTROL1.nativeObject
	oG2antt.Items.AddBar(Item,"Task","12/04/2017","12/14/2017")
return

local oG2antt,var_Chart,var_Column,var_Column1,var_Items

oG2antt = form.EXG2ANTTCHARTACTIVEXCONTROL1.nativeObject
oG2antt.BeginUpdate()
var_Chart = oG2antt.Chart
	var_Chart.LevelCount = 2
	var_Chart.FirstVisibleDate = "12/02/2017"
	// var_Chart.PaneWidth(false) = 256
	with (oG2antt)
		TemplateDef = [dim var_Chart]
		TemplateDef = var_Chart
		Template = [var_Chart.PaneWidth(False) = 256]
	endwith
var_Column = oG2antt.Columns.Add("Item")
	var_Column.DisplayFilterButton = true
	var_Column.FilterList = 9504 /*exShowExclude | exShowFocusItem | exShowCheckBox | exSortItemsAsc*/
var_Column1 = oG2antt.Columns.Add("Pos")
	var_Column1.AllowSizing = false
	var_Column1.AllowSort = false
	var_Column1.Width = 32
	var_Column1.FormatColumn = "1 apos ``"
	var_Column1.Position = 0
var_Items = oG2antt.Items
	var_Items.AddItem("Item A")
	var_Items.AddItem("Item B")
	var_Items.AddItem("Item C")
oG2antt.FilterBarFont = oG2antt.Font
oG2antt.FilterBarPrompt = Str(oG2antt.FormatABC("`<b>` + value",oG2antt.FilterBarPrompt))
oG2antt.FilterBarCaption = "`<b><r>` + value + `</b><fgcolor=808080>` + ( matchitemcount < 0 ? ( ( len(value) ? `<br>` : `` ) + `<r>` + abs(matchitemcount + 1) + ` result(s)` ) : (`<fgcolor=808080>`+ itemcount + ` item(s)`) )"
oG2antt.FilterBarPromptVisible = 3591 /*exFilterBarCompact | exFilterBarShowCloseOnRight | exFilterBarShowCloseIfRequired | exFilterBarCaptionVisible | exFilterBarVisible | exFilterBarPromptVisible*/
oG2antt.EndUpdate()
|
|
2008
|
How can I get the number of results being shown in the control's filter bar (sample 3)
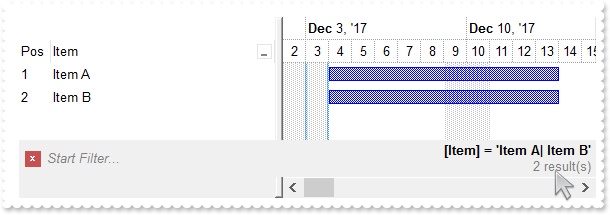
/*
with (this.EXG2ANTTCHARTACTIVEXCONTROL1.nativeObject)
	AddItem = class::nativeObject_AddItem
endwith
*/
// Occurs after a new Item has been inserted to Items collection.
function nativeObject_AddItem(Item)
	oG2antt = form.EXG2ANTTCHARTACTIVEXCONTROL1.nativeObject
	oG2antt.Items.AddBar(Item,"Task","12/04/2017","12/14/2017")
return

local oG2antt,var_Chart,var_Column,var_Column1,var_Column2,var_Items

oG2antt = form.EXG2ANTTCHARTACTIVEXCONTROL1.nativeObject
oG2antt.BeginUpdate()
var_Chart = oG2antt.Chart
	var_Chart.LevelCount = 2
	var_Chart.FirstVisibleDate = "12/02/2017"
	// var_Chart.PaneWidth(false) = 256
	with (oG2antt)
		TemplateDef = [dim var_Chart]
		TemplateDef = var_Chart
		Template = [var_Chart.PaneWidth(False) = 256]
	endwith
// oG2antt.Columns.Add("Item").DisplayFilterButton = true
var_Column = oG2antt.Columns.Add("Item")
with (oG2antt)
	TemplateDef = [dim var_Column]
	TemplateDef = var_Column
	Template = [var_Column.DisplayFilterButton = True]
endwith
var_Column1 = oG2antt.Columns.Add("Pos")
	var_Column1.AllowSizing = false
	var_Column1.AllowSort = false
	var_Column1.Width = 32
	var_Column1.FormatColumn = "1 apos ``"
	var_Column1.Position = 0
var_Items = oG2antt.Items
	var_Items.AddItem("Item A")
	var_Items.AddItem("Item B")
	var_Items.AddItem("Item C")
oG2antt.FilterBarFont = oG2antt.Font
oG2antt.FilterBarCaption = "`<b><r>` + value + `</b><fgcolor=808080>` + ( matchitemcount < 0 ? ( ( len(value) ? `<br>` : `` ) + `<r>` + abs(matchitemcount + 1) + ` result(s)` ) : ``)"
oG2antt.FilterBarPromptVisible = 2055 /*exFilterBarCompact | exFilterBarCaptionVisible | exFilterBarVisible | exFilterBarPromptVisible*/
var_Column2 = oG2antt.Columns.Item(0)
	var_Column2.FilterType = 240
	var_Column2.Filter = "Item A|Item B"
oG2antt.ApplyFilter()
oG2antt.EndUpdate()
|
|
2007
|
How can I get the number of results being shown in the control's filter bar (sample 2, compact)
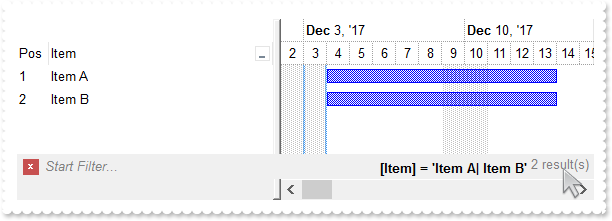
/*
with (this.EXG2ANTTCHARTACTIVEXCONTROL1.nativeObject)
	AddItem = class::nativeObject_AddItem
endwith
*/
// Occurs after a new Item has been inserted to Items collection.
function nativeObject_AddItem(Item)
	oG2antt = form.EXG2ANTTCHARTACTIVEXCONTROL1.nativeObject
	oG2antt.Items.AddBar(Item,"Task","12/04/2017","12/14/2017")
return

local oG2antt,var_Chart,var_Column,var_Column1,var_Column2,var_Items

oG2antt = form.EXG2ANTTCHARTACTIVEXCONTROL1.nativeObject
oG2antt.BeginUpdate()
var_Chart = oG2antt.Chart
	var_Chart.LevelCount = 2
	var_Chart.FirstVisibleDate = "12/02/2017"
	// var_Chart.PaneWidth(false) = 256
	with (oG2antt)
		TemplateDef = [dim var_Chart]
		TemplateDef = var_Chart
		Template = [var_Chart.PaneWidth(False) = 256]
	endwith
// oG2antt.Columns.Add("Item").DisplayFilterButton = true
var_Column = oG2antt.Columns.Add("Item")
with (oG2antt)
	TemplateDef = [dim var_Column]
	TemplateDef = var_Column
	Template = [var_Column.DisplayFilterButton = True]
endwith
var_Column1 = oG2antt.Columns.Add("Pos")
	var_Column1.AllowSizing = false
	var_Column1.AllowSort = false
	var_Column1.Width = 32
	var_Column1.FormatColumn = "1 apos ``"
	var_Column1.Position = 0
var_Items = oG2antt.Items
	var_Items.AddItem("Item A")
	var_Items.AddItem("Item B")
	var_Items.AddItem("Item C")
oG2antt.FilterBarFont = oG2antt.Font
oG2antt.FilterBarCaption = "`<b><r>` + value + `</b><fgcolor=808080>` + ( matchitemcount < 0 ? `<off -4> ` + abs(matchitemcount + 1) + ` result(s)` : ``)"
oG2antt.FilterBarPromptVisible = 2071 /*exFilterBarCompact | exFilterBarSingleLine | exFilterBarCaptionVisible | exFilterBarVisible | exFilterBarPromptVisible*/
var_Column2 = oG2antt.Columns.Item(0)
	var_Column2.FilterType = 240
	var_Column2.Filter = "Item A|Item B"
oG2antt.ApplyFilter()
oG2antt.EndUpdate()
|
|
2006
|
How can I get the number of results being shown in the control's filter bar (sample 1)
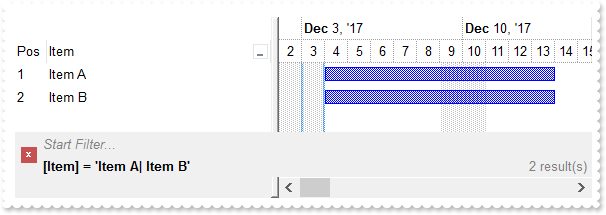
/*
with (this.EXG2ANTTCHARTACTIVEXCONTROL1.nativeObject)
	AddItem = class::nativeObject_AddItem
endwith
*/
// Occurs after a new Item has been inserted to Items collection.
function nativeObject_AddItem(Item)
	oG2antt = form.EXG2ANTTCHARTACTIVEXCONTROL1.nativeObject
	oG2antt.Items.AddBar(Item,"Task","12/04/2017","12/14/2017")
return

local oG2antt,var_Chart,var_Column,var_Column1,var_Column2,var_Items

oG2antt = form.EXG2ANTTCHARTACTIVEXCONTROL1.nativeObject
oG2antt.BeginUpdate()
var_Chart = oG2antt.Chart
	var_Chart.LevelCount = 2
	var_Chart.FirstVisibleDate = "12/02/2017"
	// var_Chart.PaneWidth(false) = 256
	with (oG2antt)
		TemplateDef = [dim var_Chart]
		TemplateDef = var_Chart
		Template = [var_Chart.PaneWidth(False) = 256]
	endwith
// oG2antt.Columns.Add("Item").DisplayFilterButton = true
var_Column = oG2antt.Columns.Add("Item")
with (oG2antt)
	TemplateDef = [dim var_Column]
	TemplateDef = var_Column
	Template = [var_Column.DisplayFilterButton = True]
endwith
var_Column1 = oG2antt.Columns.Add("Pos")
	var_Column1.AllowSizing = false
	var_Column1.AllowSort = false
	var_Column1.Width = 32
	var_Column1.FormatColumn = "1 apos ``"
	var_Column1.Position = 0
var_Items = oG2antt.Items
	var_Items.AddItem("Item A")
	var_Items.AddItem("Item B")
	var_Items.AddItem("Item C")
oG2antt.FilterBarFont = oG2antt.Font
oG2antt.FilterBarCaption = "`<b>` + value + `</b><r><fgcolor=808080>` + ( matchitemcount < 0 ? abs(matchitemcount + 1) + ` result(s)` : ``)"
oG2antt.FilterBarPromptVisible = 7 /*exFilterBarCaptionVisible | exFilterBarVisible | exFilterBarPromptVisible*/
var_Column2 = oG2antt.Columns.Item(0)
	var_Column2.FilterType = 240
	var_Column2.Filter = "Item A|Item B"
oG2antt.ApplyFilter()
oG2antt.EndUpdate()
|
|
2005
|
FilterBarCaption Predefined Keywords
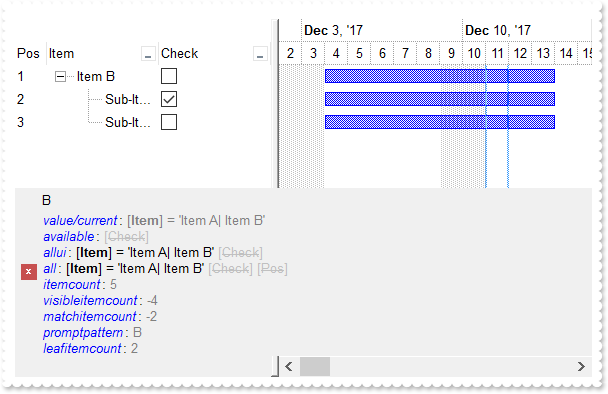
/*
with (this.EXG2ANTTCHARTACTIVEXCONTROL1.nativeObject)
	AddItem = class::nativeObject_AddItem
endwith
*/
// Occurs after a new Item has been inserted to Items collection.
function nativeObject_AddItem(Item)
	oG2antt = form.EXG2ANTTCHARTACTIVEXCONTROL1.nativeObject
	oG2antt.Items.AddBar(Item,"Task","12/04/2017","12/14/2017")
return

/*
with (this.EXG2ANTTCHARTACTIVEXCONTROL1.nativeObject)
	AfterExpandItem = class::nativeObject_AfterExpandItem
endwith
*/
// Fired after an item is expanded (collapsed).
function nativeObject_AfterExpandItem(Item)
	oG2antt = form.EXG2ANTTCHARTACTIVEXCONTROL1.nativeObject
	oG2antt.Refresh()
return

local h,oG2antt,var_Chart,var_Column,var_Column1,var_Column2,var_Column3,var_Editor,var_Items

oG2antt = form.EXG2ANTTCHARTACTIVEXCONTROL1.nativeObject
oG2antt.BeginUpdate()
var_Chart = oG2antt.Chart
	var_Chart.LevelCount = 2
	var_Chart.FirstVisibleDate = "12/02/2017"
	// var_Chart.PaneWidth(false) = 256
	with (oG2antt)
		TemplateDef = [dim var_Chart]
		TemplateDef = var_Chart
		Template = [var_Chart.PaneWidth(False) = 256]
	endwith
oG2antt.LinesAtRoot = -1
// oG2antt.Columns.Add("Item").DisplayFilterButton = true
var_Column = oG2antt.Columns.Add("Item")
with (oG2antt)
	TemplateDef = [dim var_Column]
	TemplateDef = var_Column
	Template = [var_Column.DisplayFilterButton = True]
endwith
var_Column1 = oG2antt.Columns.Add("Check")
	var_Editor = var_Column1.Editor
		var_Editor.EditType = 19
		// var_Editor.Option(17) = 1
		with (oG2antt)
			TemplateDef = [dim var_Editor]
			TemplateDef = var_Editor
			Template = [var_Editor.Option(17) = 1]
		endwith
	var_Column1.DisplayFilterButton = true
	var_Column1.DisplayFilterPattern = false
	var_Column1.FilterType = 6
var_Column2 = oG2antt.Columns.Add("Pos")
	var_Column2.AllowSizing = false
	var_Column2.AllowSort = false
	var_Column2.Width = 32
	var_Column2.FormatColumn = "1 apos ``"
	var_Column2.Position = 0
var_Items = oG2antt.Items
	var_Items.AddItem("Item A")
	h = var_Items.AddItem("Item B")
	// var_Items.CellState(var_Items.InsertItem(h,null,"Sub-Item B1"),1) = 1
	with (oG2antt)
		TemplateDef = [dim var_Items]
		TemplateDef = var_Items
		Template = [var_Items.CellState(InsertItem(h,,"Sub-Item B1"),1) = 1]
	endwith
	var_Items.InsertItem(h,null,"Sub-Item B2")
	// var_Items.ExpandItem(h) = true
	with (oG2antt)
		TemplateDef = [dim var_Items,h]
		TemplateDef = var_Items
		TemplateDef = h
		Template = [var_Items.ExpandItem(h) = True]
	endwith
	var_Items.AddItem("Item C")
oG2antt.FilterInclude = 1
oG2antt.FilterBarFont = oG2antt.Font
oG2antt.FilterBarCaption = "`<fgcolor=0000FF><i>value/current</i></fgcolor>: <fgcolor=808080>` + value + `</fgcolor>` + `<br><fgcolor=0000FF><i>available</i></fgcolor>: ` + available + `<br><fgcolor=0000FF><i>allui</i></fgcolor>: ` + allui + `<br><fgcolor=0000FF><i>all</i></fgcolor>: ` + all + `<br><fgcolor=0000FF><i>itemcount</i></fgcolor>: <fgcolor=808080>` + itemcount + `</fgcolor>`+ `<br><fgcolor=0000FF><i>visibleitemcount</i></fgcolor>: <fgcolor=808080>` + visibleitemcount + `</fgcolor>`+ `<br><fgcolor=0000FF><i>matchitemcount</i></fgcolor>: <fgcolor=808080>` + matchitemcount + `</fgcolor>`+ `<br><fgcolor=0000FF><i>promptpattern</i></fgcolor>: <fgcolor=808080>` + promptpattern + `</fgcolor>`+ `<br><fgcolor=0000FF><i>leafitemcount</i></fgcolor>: <fgcolor=808080>` + leafitemcount +" ;
	 +" `</fgcolor>`"
oG2antt.FilterBarPromptPattern = "B"
oG2antt.FilterBarPromptVisible = 7 /*exFilterBarCaptionVisible | exFilterBarVisible | exFilterBarPromptVisible*/
var_Column3 = oG2antt.Columns.Item(0)
	var_Column3.FilterType = 240
	var_Column3.Filter = "Item A|Item B"
oG2antt.ApplyFilter()
oG2antt.EndUpdate()
|
|
2004
|
I am using filter prompt feature, and also column's filter, just wondering if possible to compact displaying the filter bar so it won't show on multiple lines
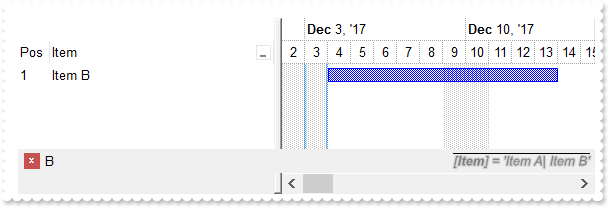
/*
with (this.EXG2ANTTCHARTACTIVEXCONTROL1.nativeObject)
	AddItem = class::nativeObject_AddItem
endwith
*/
// Occurs after a new Item has been inserted to Items collection.
function nativeObject_AddItem(Item)
	oG2antt = form.EXG2ANTTCHARTACTIVEXCONTROL1.nativeObject
	oG2antt.Items.AddBar(Item,"Task","12/04/2017","12/14/2017")
return

local oG2antt,var_Chart,var_Column,var_Column1,var_Column2,var_Items

oG2antt = form.EXG2ANTTCHARTACTIVEXCONTROL1.nativeObject
oG2antt.BeginUpdate()
var_Chart = oG2antt.Chart
	var_Chart.LevelCount = 2
	var_Chart.FirstVisibleDate = "12/02/2017"
	// var_Chart.PaneWidth(false) = 256
	with (oG2antt)
		TemplateDef = [dim var_Chart]
		TemplateDef = var_Chart
		Template = [var_Chart.PaneWidth(False) = 256]
	endwith
// oG2antt.Columns.Add("Item").DisplayFilterButton = true
var_Column = oG2antt.Columns.Add("Item")
with (oG2antt)
	TemplateDef = [dim var_Column]
	TemplateDef = var_Column
	Template = [var_Column.DisplayFilterButton = True]
endwith
var_Column1 = oG2antt.Columns.Add("Pos")
	var_Column1.AllowSizing = false
	var_Column1.AllowSort = false
	var_Column1.Width = 32
	var_Column1.FormatColumn = "1 apos ``"
	var_Column1.Position = 0
var_Items = oG2antt.Items
	var_Items.AddItem("Item A")
	var_Items.AddItem("Item B")
	var_Items.AddItem("Item C")
oG2antt.FilterBarFont = oG2antt.Font
oG2antt.FilterBarCaption = "`<r><i><fgcolor=808080><upline><solidline><sha ;;0>` + value"
oG2antt.FilterBarPromptPattern = "B"
oG2antt.FilterBarPromptVisible = 2067 /*exFilterBarCompact | exFilterBarSingleLine | exFilterBarVisible | exFilterBarPromptVisible*/
var_Column2 = oG2antt.Columns.Item(0)
	var_Column2.FilterType = 240
	var_Column2.Filter = "Item A|Item B"
oG2antt.ApplyFilter()
oG2antt.EndUpdate()
|
|
2003
|
Just wondering if it is possible to show the filter bar's close button on the right ( sample 2 )
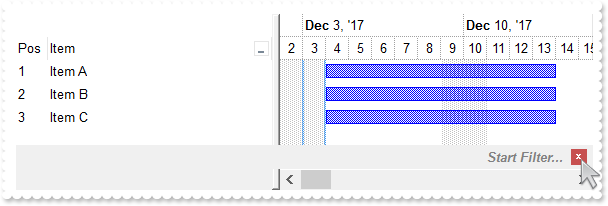
/*
with (this.EXG2ANTTCHARTACTIVEXCONTROL1.nativeObject)
	AddItem = class::nativeObject_AddItem
endwith
*/
// Occurs after a new Item has been inserted to Items collection.
function nativeObject_AddItem(Item)
	oG2antt = form.EXG2ANTTCHARTACTIVEXCONTROL1.nativeObject
	oG2antt.Items.AddBar(Item,"Task","12/04/2017","12/14/2017")
return

local oG2antt,var_Chart,var_Column,var_Column1,var_Items

oG2antt = form.EXG2ANTTCHARTACTIVEXCONTROL1.nativeObject
oG2antt.BeginUpdate()
var_Chart = oG2antt.Chart
	var_Chart.LevelCount = 2
	var_Chart.FirstVisibleDate = "12/02/2017"
	// var_Chart.PaneWidth(false) = 256
	with (oG2antt)
		TemplateDef = [dim var_Chart]
		TemplateDef = var_Chart
		Template = [var_Chart.PaneWidth(False) = 256]
	endwith
// oG2antt.Columns.Add("Item").DisplayFilterButton = true
var_Column = oG2antt.Columns.Add("Item")
with (oG2antt)
	TemplateDef = [dim var_Column]
	TemplateDef = var_Column
	Template = [var_Column.DisplayFilterButton = True]
endwith
var_Column1 = oG2antt.Columns.Add("Pos")
	var_Column1.AllowSizing = false
	var_Column1.AllowSort = false
	var_Column1.Width = 32
	var_Column1.FormatColumn = "1 apos ``"
	var_Column1.Position = 0
var_Items = oG2antt.Items
	var_Items.AddItem("Item A")
	var_Items.AddItem("Item B")
	var_Items.AddItem("Item C")
oG2antt.FilterBarPromptVisible = 1281 /*exFilterBarShowCloseOnRight | exFilterBarToggle | exFilterBarPromptVisible*/
oG2antt.FilterBarPrompt = Str(oG2antt.FormatABC("`<r>` + value",oG2antt.FilterBarPrompt))
oG2antt.EndUpdate()
|
|
2002
|
Just wondering if it is possible to show the filter bar's close button on the right ( sample 1 )
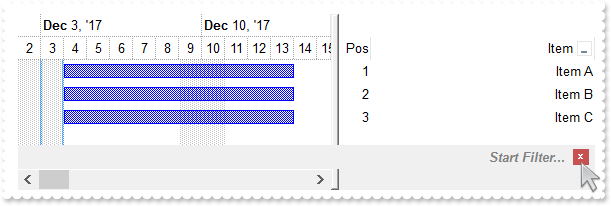
/*
with (this.EXG2ANTTCHARTACTIVEXCONTROL1.nativeObject)
	AddItem = class::nativeObject_AddItem
endwith
*/
// Occurs after a new Item has been inserted to Items collection.
function nativeObject_AddItem(Item)
	oG2antt = form.EXG2ANTTCHARTACTIVEXCONTROL1.nativeObject
	oG2antt.Items.AddBar(Item,"Task","12/04/2017","12/14/2017")
return

local oG2antt,var_Chart,var_Column,var_Column1,var_Items

oG2antt = form.EXG2ANTTCHARTACTIVEXCONTROL1.nativeObject
oG2antt.BeginUpdate()
var_Chart = oG2antt.Chart
	var_Chart.LevelCount = 2
	var_Chart.FirstVisibleDate = "12/02/2017"
	// var_Chart.PaneWidth(false) = 256
	with (oG2antt)
		TemplateDef = [dim var_Chart]
		TemplateDef = var_Chart
		Template = [var_Chart.PaneWidth(False) = 256]
	endwith
oG2antt.RightToLeft = true
// oG2antt.Columns.Add("Item").DisplayFilterButton = true
var_Column = oG2antt.Columns.Add("Item")
with (oG2antt)
	TemplateDef = [dim var_Column]
	TemplateDef = var_Column
	Template = [var_Column.DisplayFilterButton = True]
endwith
var_Column1 = oG2antt.Columns.Add("Pos")
	var_Column1.AllowSizing = false
	var_Column1.AllowSort = false
	var_Column1.Width = 32
	var_Column1.FormatColumn = "1 apos ``"
	var_Column1.Position = 0
var_Items = oG2antt.Items
	var_Items.AddItem("Item A")
	var_Items.AddItem("Item B")
	var_Items.AddItem("Item C")
oG2antt.FilterBarPromptVisible = 257 /*exFilterBarToggle | exFilterBarPromptVisible*/
oG2antt.EndUpdate()
|
|
2001
|
How can I change the visual appearance of the filter bar's close button (EBN)
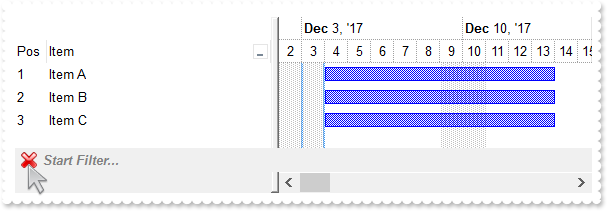
/*
with (this.EXG2ANTTCHARTACTIVEXCONTROL1.nativeObject)
	AddItem = class::nativeObject_AddItem
endwith
*/
// Occurs after a new Item has been inserted to Items collection.
function nativeObject_AddItem(Item)
	oG2antt = form.EXG2ANTTCHARTACTIVEXCONTROL1.nativeObject
	oG2antt.Items.AddBar(Item,"Task","12/04/2017","12/14/2017")
return

local oG2antt,var_Appearance,var_Chart,var_Column,var_Column1,var_Items

oG2antt = form.EXG2ANTTCHARTACTIVEXCONTROL1.nativeObject
oG2antt.BeginUpdate()
var_Chart = oG2antt.Chart
	var_Chart.LevelCount = 2
	var_Chart.FirstVisibleDate = "12/02/2017"
	// var_Chart.PaneWidth(false) = 256
	with (oG2antt)
		TemplateDef = [dim var_Chart]
		TemplateDef = var_Chart
		Template = [var_Chart.PaneWidth(False) = 256]
	endwith
var_Appearance = oG2antt.VisualAppearance
	var_Appearance.Add(1,"gBFLBCJwBAEHhEJAAEhABHQDg6AADACAxRDgMQBQKAAzAJBIYhiG4cYCgMZhXDOCYXABCEYRXBIZQ7BKNIxjSJ5BhIAAyDSJMjSRJUEhqGCWYDleYYYAKHIMQLOg7IJjyI4/SJAYCydKAWhxIaZKJHCZoEDaTAADCNVAQp6MEIJVbVEI0e79OgBLp/Z7kECIJJAaRjHQdJxGLA8EhtCQhCZteK6SgMKJYXhWQYRXI1JwvMBrWrdQjiOYELQtMKmSZNLYGG4dR5SVJbcYhSYsRRFMoyDIOXYDLKsdYqSpXIThObEGgaPqJYjsUjCMKnR7HVIURrBPC9TBPE69ZgmC6ucKPX51ShKFaBWDZcwFAS+UBuYCAILiEAQGZ1XT8OROicbgJgSTJRlCaZeDsHY7QGR4xkSYp3CaExZAQMgalQYAwjCAAfBANxcA2TgKAUOpDCGFhKg0RpXCwCwDHQHQHEyAIkCkOhbFOGA8A8DohBgRg9AccZcn8EpEjMLI2C2DYxAgQgvAIUIVkoAAPBQDJlECTZ3CCYwDACQwUA8A5MCAWAWDiQi4l8aQOEgLJuBgBgDmYFAzEoIoIl0WALgKYJbBABADAAHgHg8VAMmqCQQDMXABAATYwTmNwBDATJXAiAgjHmNQ5lgQ5QEQEQMmcWg/GwD5ylyNw2gMcJcjsBgBgOQQDDhRpVAMMwnDBFw1B0Ax8D0DxOmmJJIGQTY5hGMAwkwM4CAYLZAmAOJnAqAojiIGg6iieYkmeAYOHaK" ;
	 +"JDCyCwjH6AoggsQpQliAJLhgaJ0CESBTnyDwjk+cg4g4P5IHIHJ+BWRRzlYWAxiOUxihsY4KjKLJRGqC44FCegkkkM58iAKAPnIWIWD8SRSFSfQnkmewUhYP4GiGKJ7G0TIbCSUoggqUo0lAQ4LnEcBcD8Coiiif4nE+eAAn2HpOkcFJqi4T5SkyMw/kqQown8IBIBOdA+A+DJrBqVxXEqYo4lCApLhGHBnD8S4ymyfxmg+cwQkQP5egOUZIWoEAkjIeIPBMBJBD+TBjBifwvkuc58hQJQPmFrYykkchclSApKjGOBuD+TRDFCfw3mmIxNi8FxFlOXhVC4aYDFyPgvg2YBcBcLZGCGCJ0DSLRzGSWQ/lmY5+mEP5gmMDBZRSMRsFsOxMhMJJ/DsTpTnwaQaE+N5ojuNhdEYNI5C4TZJO1GRDmCaxnA2Yx4n8IpIjOTBQBQC5TgyYw7gUYRYikC0BYRwsDQBoB8eA6Q2hsE0BUXgywZtYCyHMKwnxSAhAQHkIQhRrBaDsCwA4ERiB2EWAIYIXhhiVEgAEUYwwYjyASLge4FhHgRDkM8OQih0jWPkGgBBAQ")
// oG2antt.Columns.Add("Item").DisplayFilterButton = true
var_Column = oG2antt.Columns.Add("Item")
with (oG2antt)
	TemplateDef = [dim var_Column]
	TemplateDef = var_Column
	Template = [var_Column.DisplayFilterButton = True]
endwith
var_Column1 = oG2antt.Columns.Add("Pos")
	var_Column1.AllowSizing = false
	var_Column1.AllowSort = false
	var_Column1.Width = 32
	var_Column1.FormatColumn = "1 apos ``"
	var_Column1.Position = 0
var_Items = oG2antt.Items
	var_Items.AddItem("Item A")
	var_Items.AddItem("Item B")
	var_Items.AddItem("Item C")
oG2antt.FilterBarPromptVisible = 257 /*exFilterBarToggle | exFilterBarPromptVisible*/
oG2antt.Template = [Background(1) = 16777216] // oG2antt.Background(1) = 0x1000000
oG2antt.EndUpdate()
|